Skip to content

Chartink Articles

Updates, Tutorials & News

Tag: 52 week high

52-week high/low scan

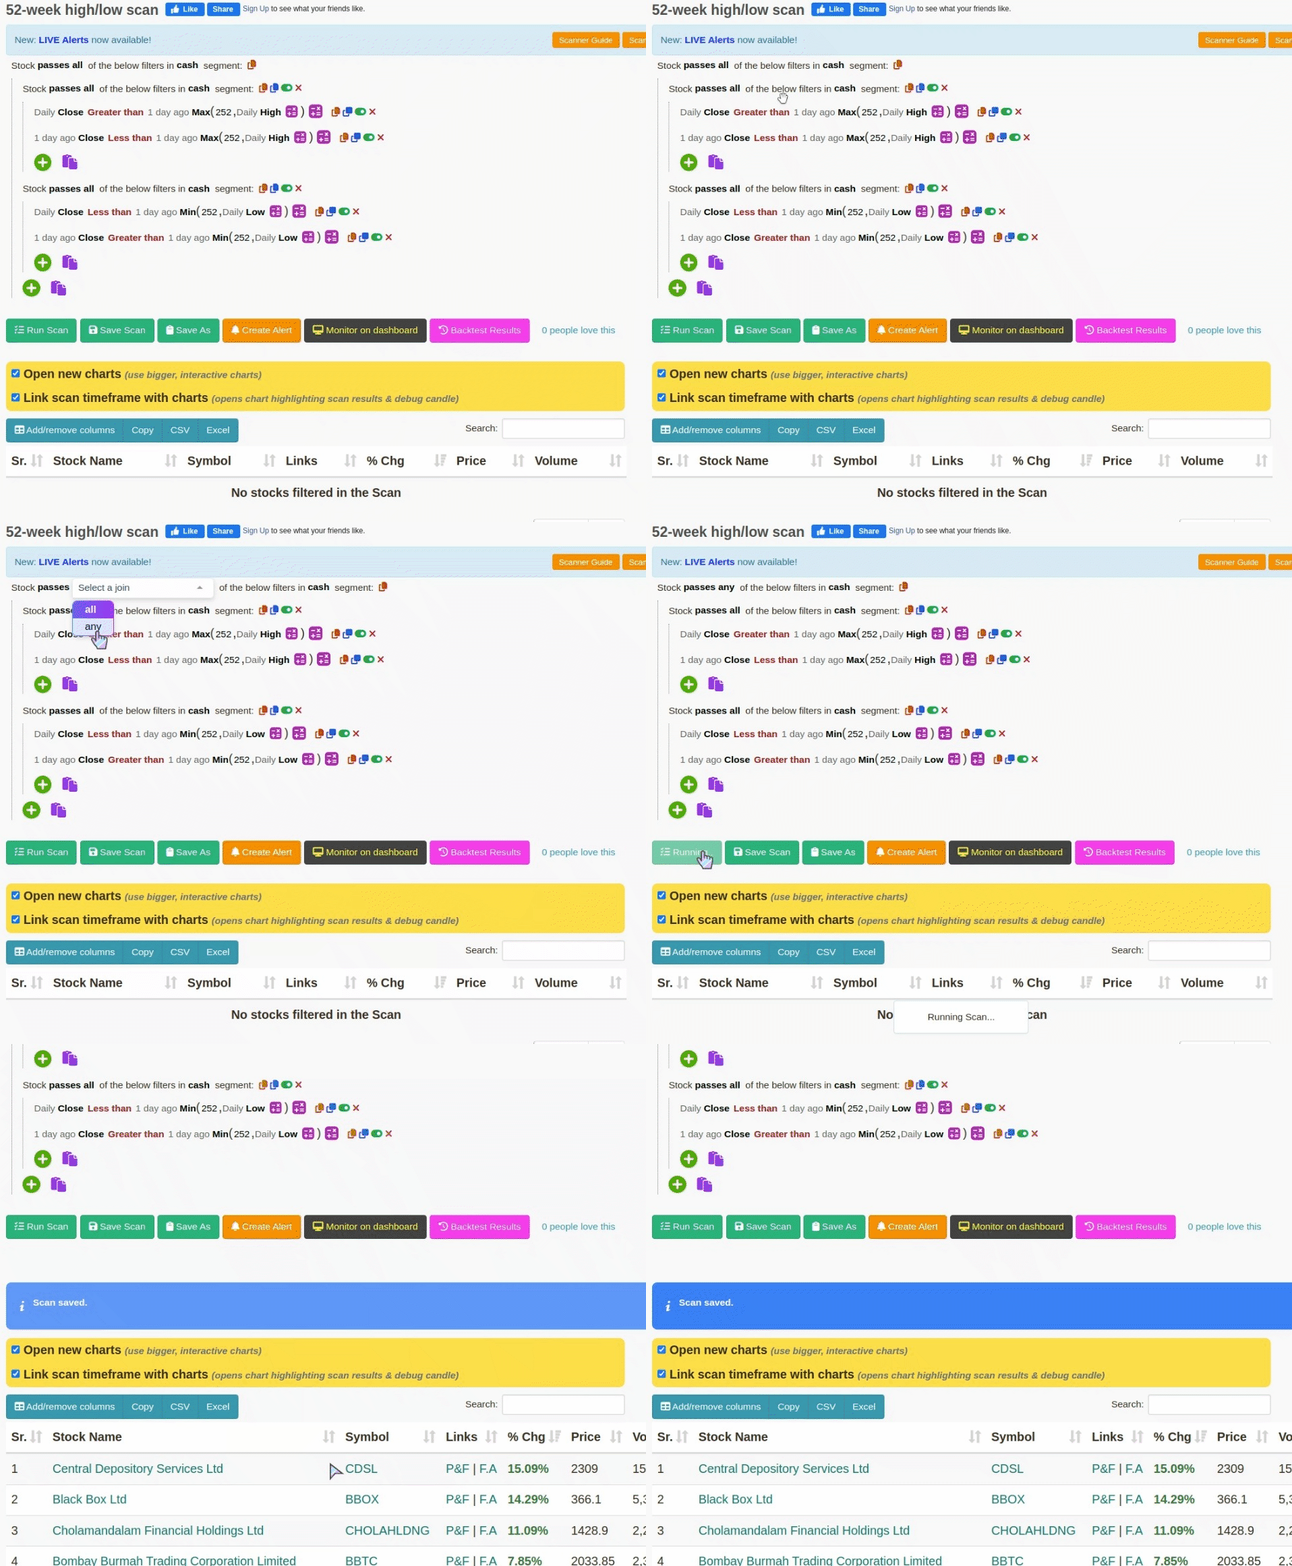
Scanning stocks that have touched their 52-week high OR 52-week low, 52 weeks consists of 252 trading days. We’ll be using our Min/Max functions with a duration of 252 days, along with the “high/low” stock attribute, to filter such stocks.

Scanner: 52-week high/low scan
Author AkashPosted on January 3, 2017June 28, 2024Categories scannerTags 52 week high, 52 week low nse stocks, stocks at lows or high67 Comments on 52-week high/low scan

Recent Posts

  • Atlas Dashboard – Grouping Functions
  • Easily access fundamental stock data with just one click.
  • Financial trend dashboard
  • Web notification troubleshooting
  • Measure – Groupcount

Recent Comments

  • Chartink support - Aaron on Scanner User Guide
  • Chartink support - Aaron on Scanner User Guide
  • Devendra on Scanner User Guide
  • EH on Scanner User Guide
  • Chartink support on Scanner User Guide

Archives

  • March 2025
  • May 2024
  • March 2024
  • December 2022
  • July 2022
  • September 2021
  • August 2021
  • July 2021
  • May 2021
  • April 2021
  • October 2020
  • August 2020
  • June 2020
  • May 2020
  • March 2020
  • February 2020
  • January 2020
  • December 2019
  • November 2019
  • July 2019
  • May 2019
  • April 2019
  • March 2019
  • July 2018
  • June 2018
  • April 2018
  • February 2018
  • December 2017
  • November 2017
  • June 2017
  • January 2017
  • December 2016

Categories

  • alerts
  • atlas
  • backtest
  • charts
  • Fundamentals
  • indicator
  • scanner
  • screener
  • Troubleshooting
  • Tutorials
  • Uncategorized

Meta

  • Log in
  • Entries feed
  • Comments feed
  • WordPress.org
Chartink Articles Proudly powered by WordPress