Trade and Order book data now avaliable

We’ve recently added fields from “Trade book” and “Order book” to help you gain deeper insights into how they impact the price. Below is the list of new fields added:

Trade book fields:

The below fields can be accessed across all timeframes, starting from 1 minute to a yearly timeframe

    • Buyer-initiated tradesIndicates the number of trades that were executed at sellers/offer/ask price; an increasing number would indicate buyers are more aggressive than sellers.
    • Buyer-initiated trades quantity – Indicates the number of trades that were executed at sellers/ask price; an increasing quantity would indicate more number of shares are being bought at a price as requested by sellers.
    • Buyer-initiated trades average quantity – Indicates the average quantity of trades for “buyer-initiated trades.”
    • Seller-initiated trades – Indicates the number of trades executed at a buyers/bid price; an increasing number would indicate sellers are more aggressive than buyers.
    • Seller-initiated trades quantity – Indicates the number of trades executed at a buyers/bid price; an increasing quantity would indicate more shares are being sold at a price as requested by buyers.
    • Seller-initiated trades average quantity– Indicates the average quantity of trades for “seller-initiated trades.”
    • Buyer vs. Seller initiated trades ratioA ratio of “buyer initiated trades / seller initiated trades” above 1 indicates that buyer-initiated trades are more than Seller for the given timeframe
    • Buyer vs. Seller initiated trades quantity ratioA ratio of “buyer initiated trades quantity / seller initiated trades quantity” above 1 indicates that the buyer-initiated quantity of trades is more than the Seller for the given timeframe.
    • Buyer-initiated trades VWAP – Volume weighted average price (VWAP) of trades that buyers initiated.
    • Seller-initiated trades VWAP Volume weighted average price (VWAP) of trades that sellers initiated.

These fields can be used to evaluate trades for intraday, short or long-term, as they are available across all timeframes. There has been limited research on these fields, as their availability is limited, considering the amount of data that needs to be processed for these. Here’s one interesting research paper on this.

Order book fields:

The below fields can be accessed across all timeframes, starting from 1 minute to a yearly timeframe

    • Orders Indicates the orders received for the specified timeframe, e.g., total orders within a minute
    • Orders Quantity – Indicates the number of orders received for the specified timeframe, e.g., total order quantity within a minute.
    • Buy Orders Indicates the “Buy orders” received for the specified timeframe.
    • Buy Orders Quantity Indicates the “Buy order” quantity received for the specified timeframe.
    • Sell Orders Indicates the “Sell orders” received for the specified timeframe.
    • Sell Orders Quantity  Indicates the “Sell order” quantity received for the specified timeframe.
    • Buy vs. Sell orders ratioA ratio of “Buy orders / Sell orders” above 1, indicating buy orders are more than sell orders.  
    • Buy vs. Sell quantity ratio A ratio of “Buy orders quantity / Sell orders quantity” above 1, indicating buy order quantities are more than sell order quantity.
    • Canceled Buy Orders – Indicates the total orders canceled in the specified timeframe.
    • Canceled Buy Orders Quantity Indicates total buy orders quantity canceled in the specified timeframe.
    • Canceled Sell Orders Indicates the total  sell orders canceled in the specified timeframe
    • Cancelled Sell Orders Quantity Indicates the total  sell orders  quantity canceled in the specified timeframe
    • Total Cancelled orders Indicates the total orders canceled in the specified timeframe
    • Total Cancelled orders quantity – Indicates the total order quantity canceled in the specified timeframe
    • Canceled orders ratioA ratio of “Cancelled orders / Orders” gives an idea of the pie of orders being canceled from the ones received
    • Canceled orders quantity ratio A ratio of “Cancelled orders quantity / Orders quantity” gives an idea of the pie of orders quantity being canceled from the ones received
    • Buy Orders Vwap – Volume weighted average price (VWAP) of buy orders.
    • Sell Orders Vwap – Volume weighted average price (VWAP) of sell orders.
    • Orders Vwap – Volume weighted average price (VWAP) of all orders.

The order numbers indicated above are the actual orders(not disclosed) for the cash market & hence the values will not match with the market depth seen within your broker’s terminals, which helps get a much clearer picture of how this is driving the price of a stock.

These new fields can be combined with existing functions, e.g., SMA, Min, Max, Count and so on.. to derive onto more complex indicators.

Sample dashboards

Buyer vs. Seller initiated trades

While we are working on adding more scans & dashboards for the same, I wanted you to be updated on adding these new fields. HI hope these are useful for gaining more insights along with the existing fields of technical analysis.
Now create your own Custom Indicators !

We’ve recently added the ability to create your own custom/derived indicators using existing indicators.

For example, you may have your logic of HLC3 as is “high  + low + close / 3” & would want to use this across multiple filters in different/same scans/widgets. Until now, you’d need to copy/write the logic whereever it would required.

With “custom indicators”, you can simply define its logic as:

HLC = ( current candle high + current candle low + current candle close ) / 3

Here’s the custom indicator for the above logic: https://chartink.com/indicator/hlc3

The above created indicator can then be used to create new scans/widgets: https://chartink.com/screener/close-above-hlc3 (notice the HLC indicator selection)

These are similar to having a value saved in a variable/temp working space and then using it across in multiple scans. Note, while using it across scans, you can select the timeframe for its calcuation, eg: Daily/Weekly/Monthly or Intraday candles giving you further flexibility.

To access a previous candle for a given timeframe, you can select “1/2.. candles ago”.

Below is another example from one of our users:

EOM – CUSTOM INDICATOR LOGIC
Scan using SMA on EOM(custom indicator)https://chartink.com/screener/eom-greater-than-20


Filter stocks using 1st/2nd.. or any candle in our scanner

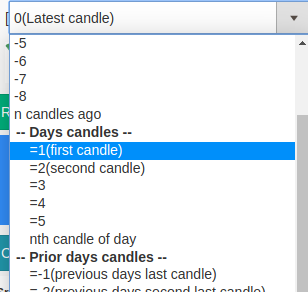
We’ve added the ability to access any candle of the latest trading day or previous days for Intraday timeframes. Useful for scans that require to access indicator values at a given point in time.

Example offset’s to access different candles for a trading day (5 minute chart)

  • [0] 5 minute close -> refers to the latest 5 minute candle
  • [=1] 5 minute close -> refers to the days’ first 5 minute candle
  • [=3] 5 minute close -> refers to the days’ third 5 minute candle
  • [=-1] 5 minute close -> refers to the previous day’s last 5 minute candle
  • [=-75] 5 minute close -> refers to the previous day’s first 5 minute candle, considering a single day has 75, 5 minute candles

If you want to access the first candle on a 5 minute timeframe(9:15-9:19:59am), you can select your required indicator/stock attribute and then change the offset to `=1` as indicated below:

Crossover Support

Days candles also support crossover/below operations. For example, to identify a crossover at the opening candle, we can do “[0] 5 minute Close Crossed above [=1] 5 minute SuperTrend(7,3)”

Example scans


Near real-time updates

We now offer near real-time NSE updates for Charts & Scans. The data is updated every 5 minutes, the latest update referring current market values. Data is directly fetched from the NSE servers.

Example: If Market opens at 9:15am, on a 5 minute interval the updates can be described as follows:

  • 9:20am – Data from 9:15am – 9:19am
  • 9:25am – Data from 9:20am – 9:24am
  • 9:30am – Data from 9:25am – 9:29am

The minimum data delay would be 0 minutes(eg: at 9:20am) and the maximum would be 5 minutes(eg: at 9:24am)

Stock Screener FAQ

List of frequently asked questions from our visitors.

How to scan NSE Future stocks?

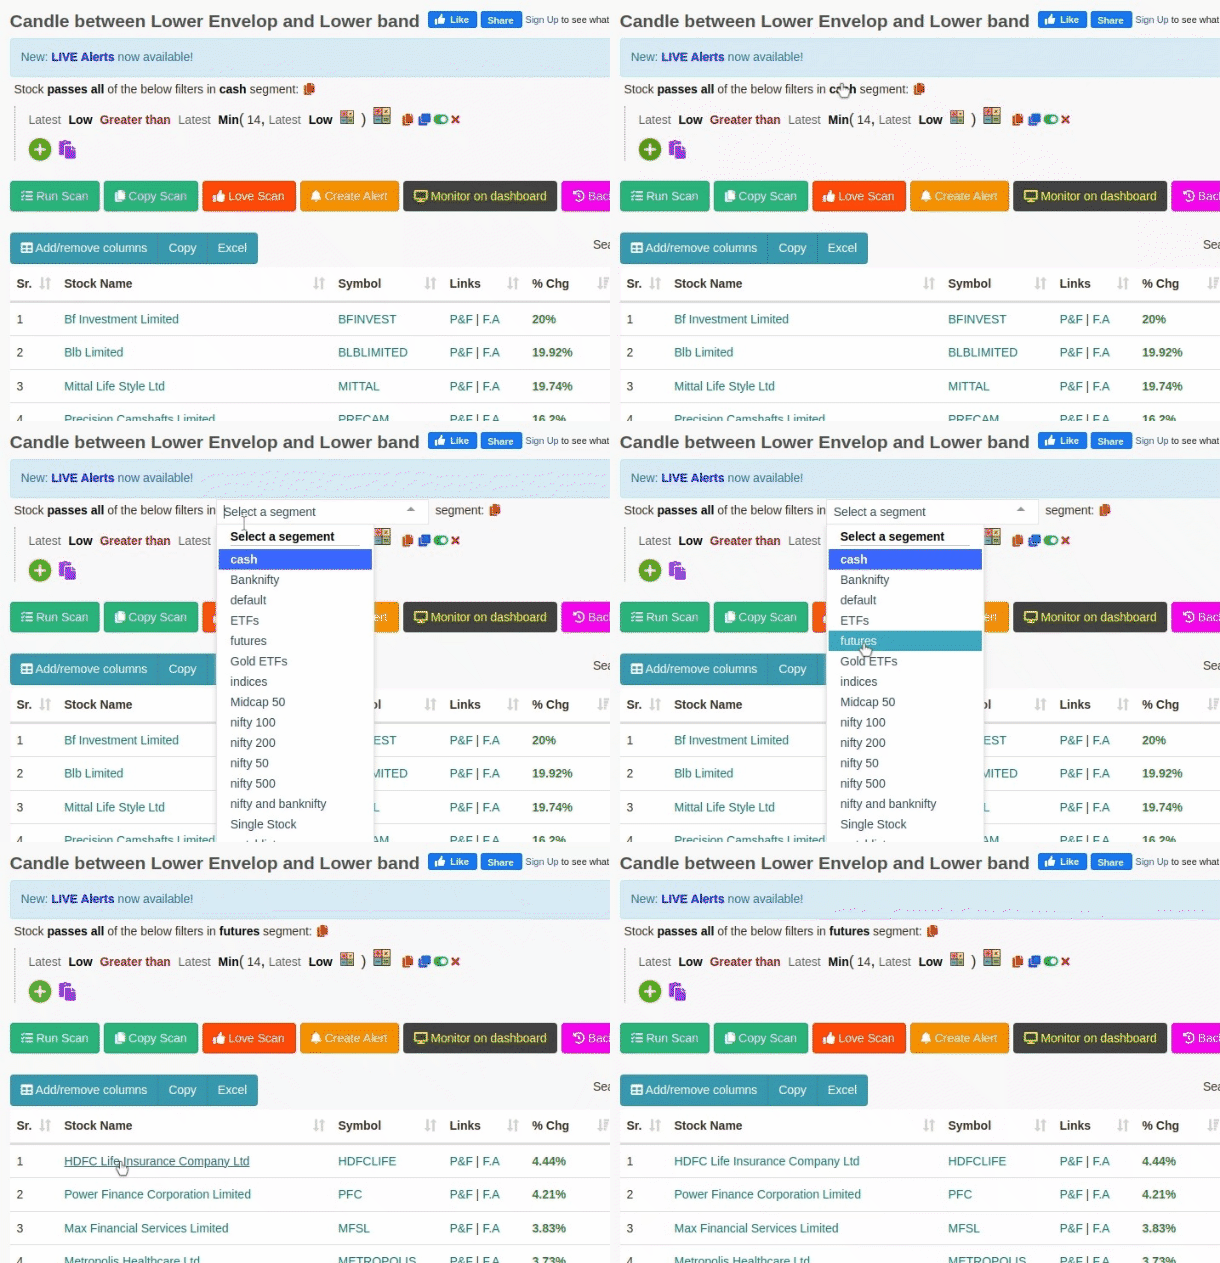
A segment filter has been added to the topmost filter for modification. These future stock prices are based on NSE cash stocks and indices only. Refer to the below image:

Changing to future stocks

How to run a scan for stocks in the Watchlist?

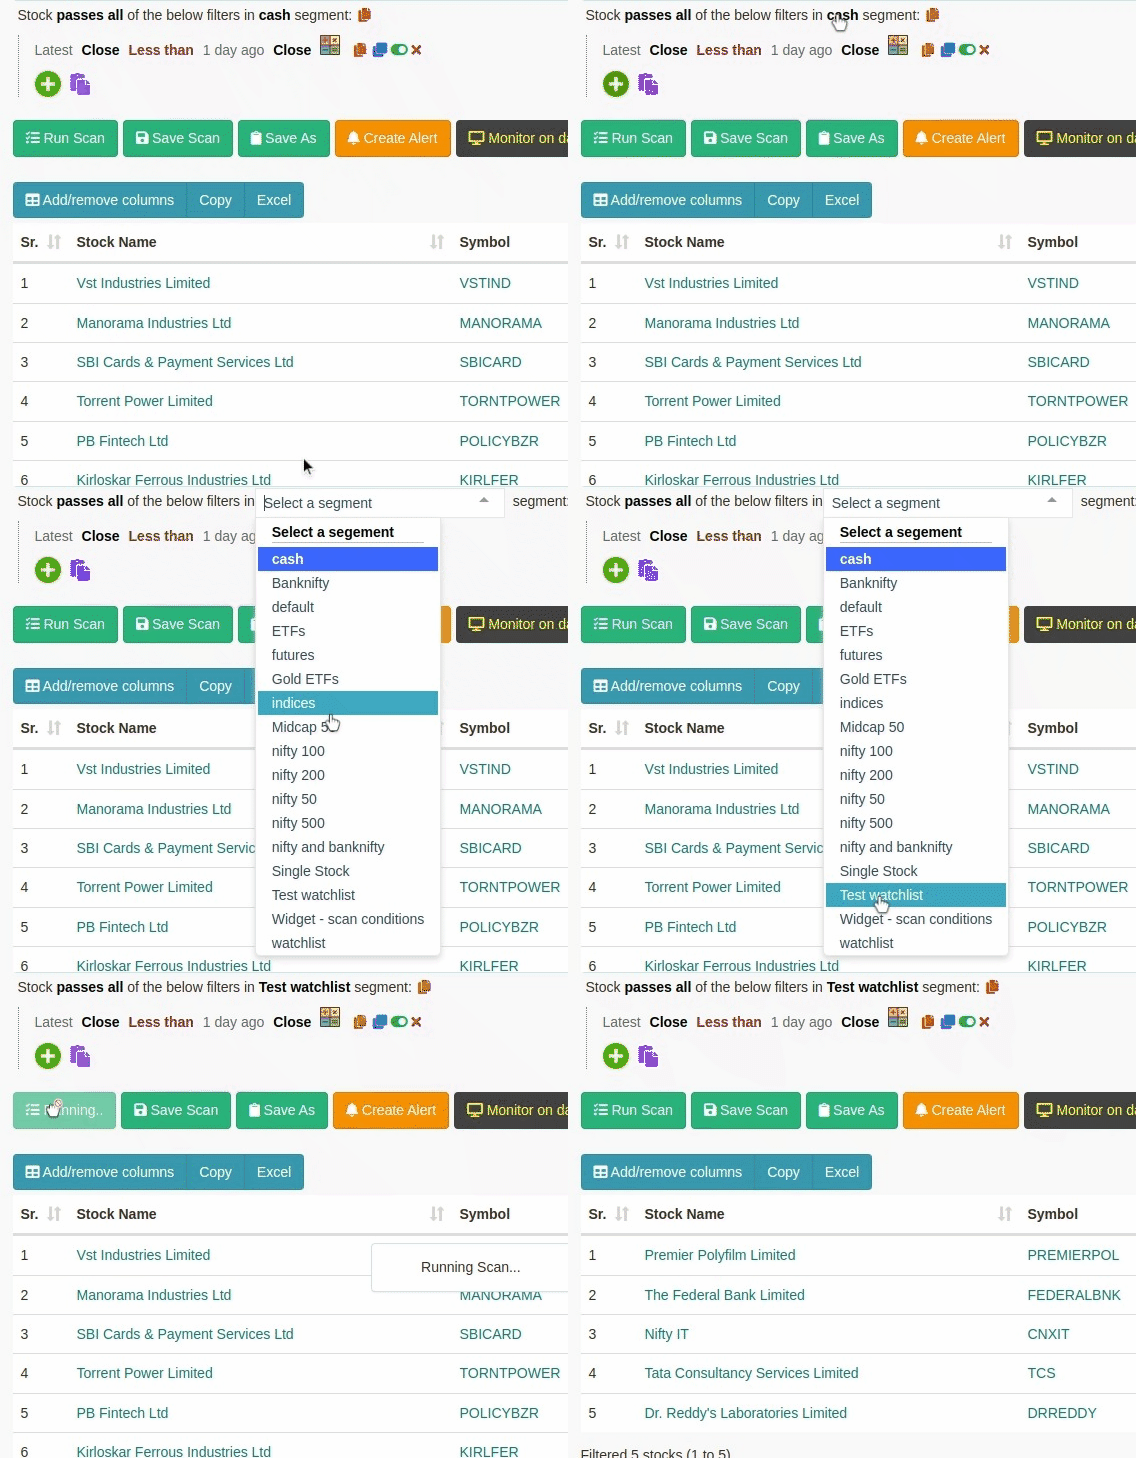
Click on the segment filter at the top of the screener page, and select “Watchlist” from the dropdown menu. The scan will then be run for the stocks in your Watchlist. You can create your new watchlist here

How to perform Weekly/Monthly scans?

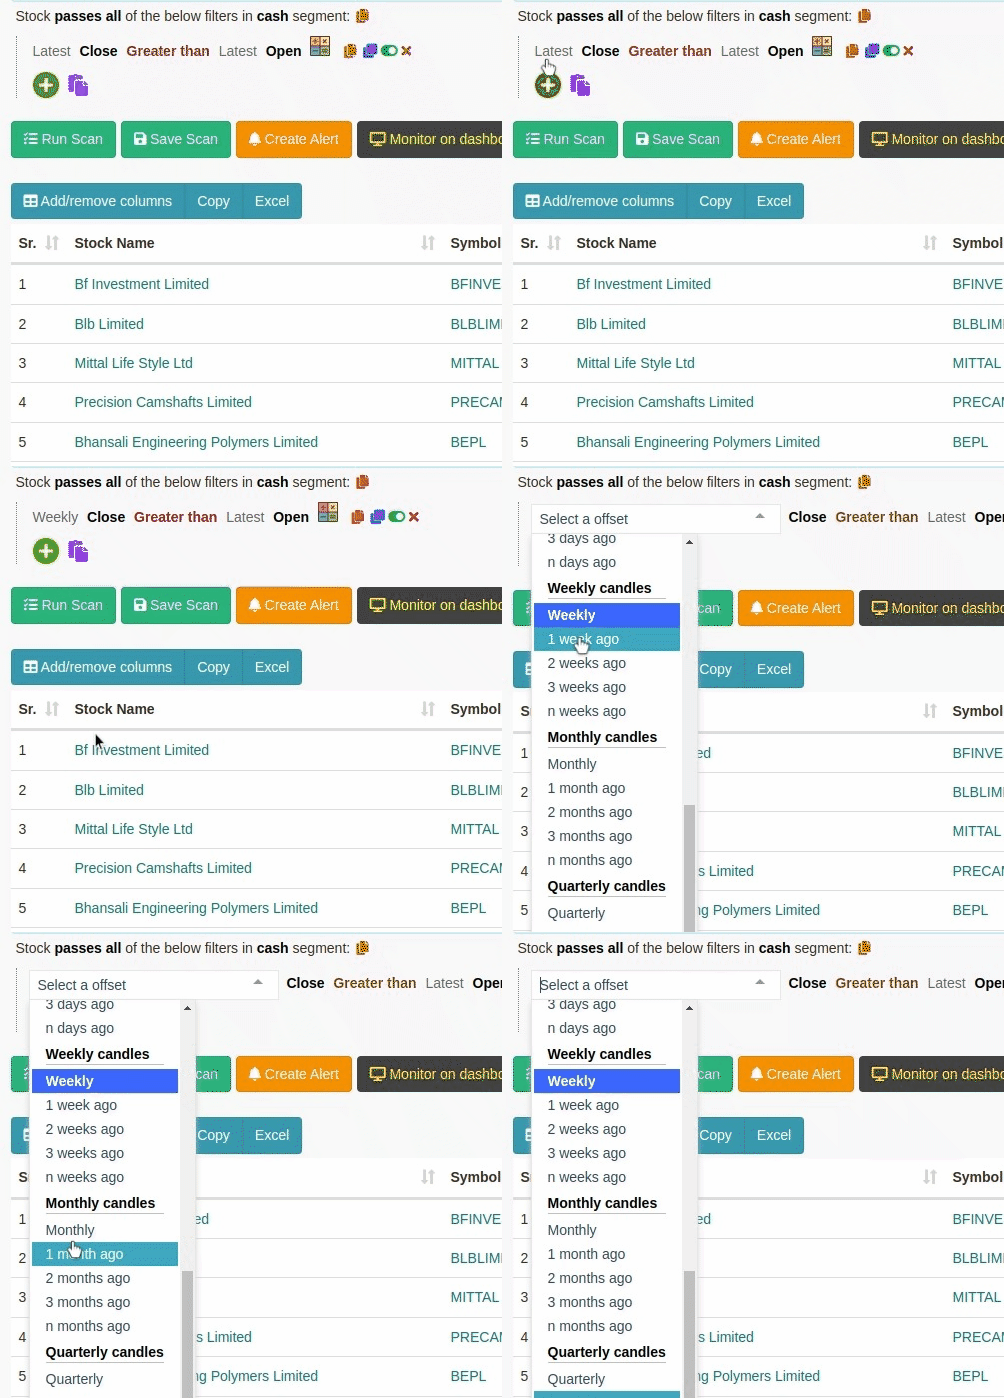
After an indicator/attribute has been added, click on the “Latest” prefix right before it and change it to any of the “Weekly” range groups, e.g., “Weekly”, “1 week ago,” and so on… The same applies to Monthly filters –

How to run Intraday timeframe scans?

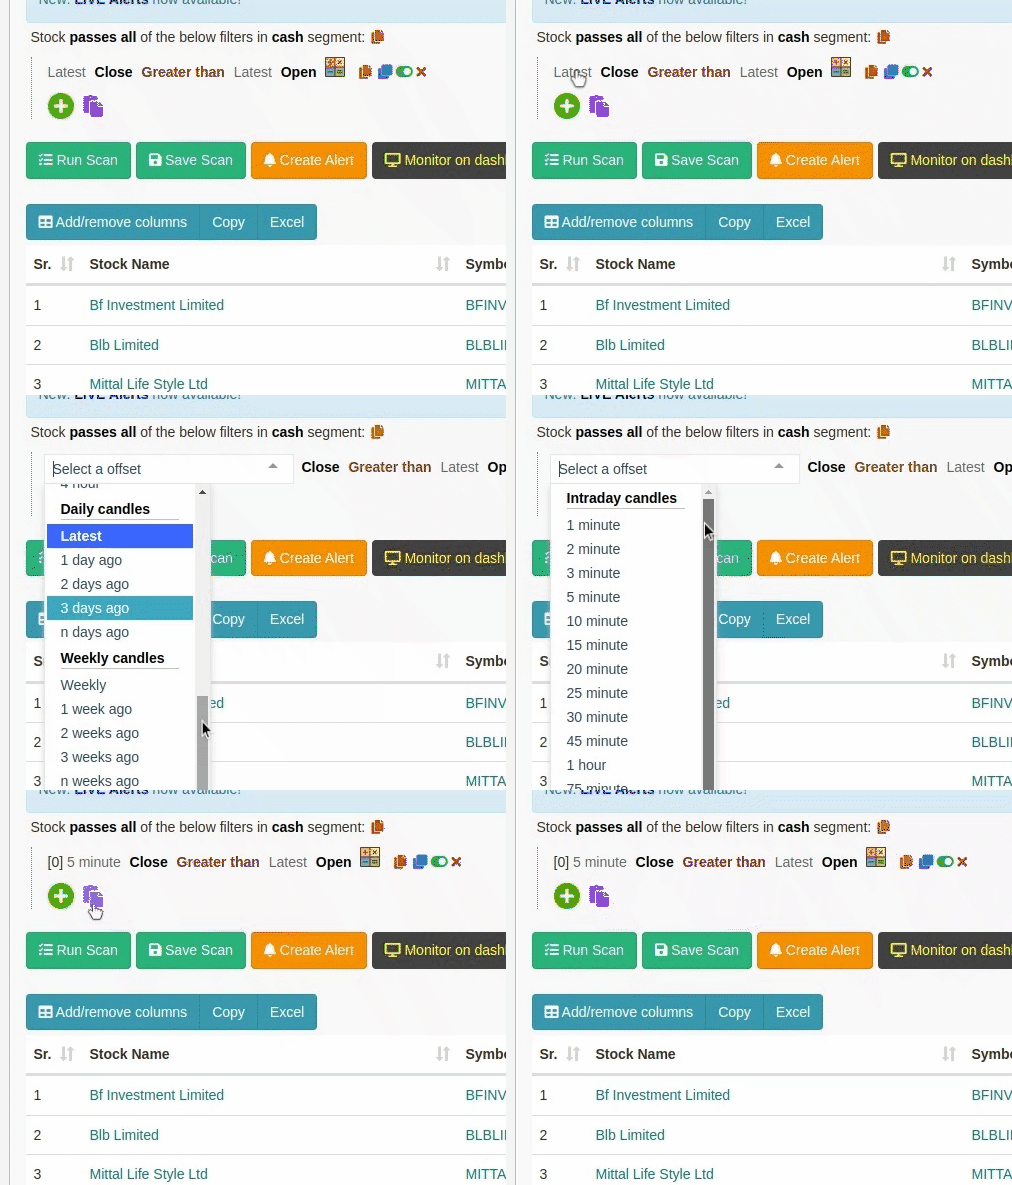
After you have added an indicator, you can click on the “latest” prefix on the left-hand side and change it to the Intraday timeframe you want. E.g.:

Intraday offsets

In a premium subscription, you can access 1/2 and 3-minute timeframes. Whereas in a free version, timeframes are from 5 minutes onwards

How to add indicators on charts?

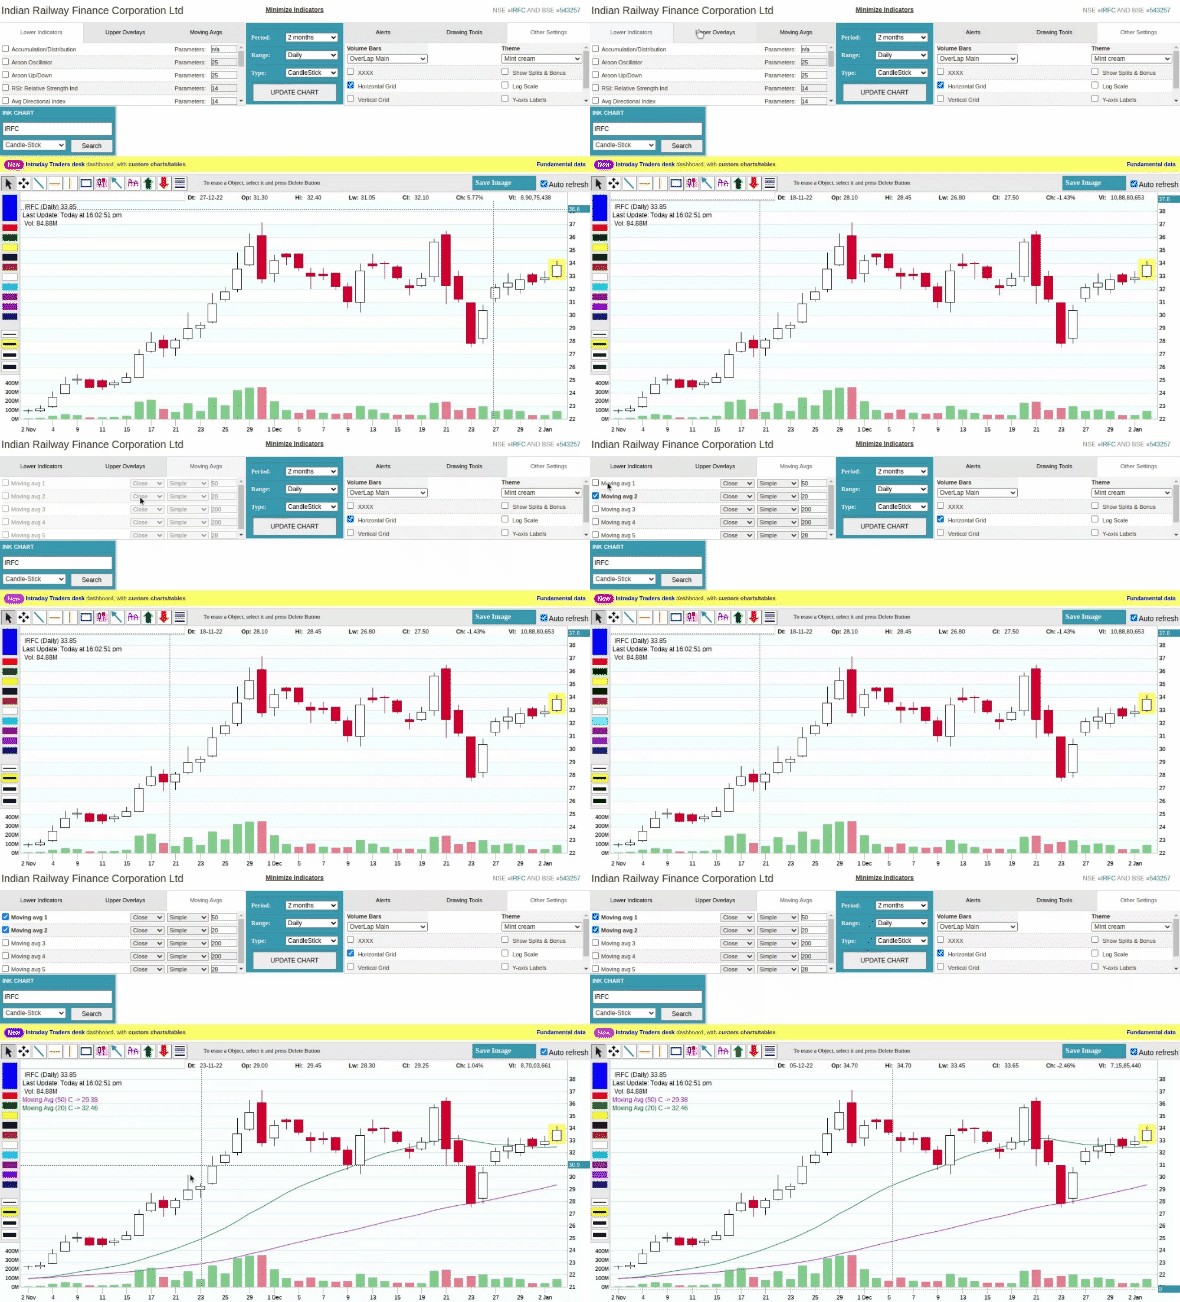
  1. Navigate to the chart of the stock you want to analyze.
  2. Select the “Indicators” button on the left side of the chart. To add an indicator to a chart, follow these steps:
  3. Scroll through the list of available indicators and select the one you want to add to the chart. Once you open a chart, the left side has an option for indicators; you can select an indicator per your preference.
Adding SMA’s indicator on chart’s

Do you show or add Pre-Market data?

Pre-market data for the current day is available at 9:09 am and includes data up until 09:08:59 am. Our scans for daily, weekly, monthly, quarterly, and yearly candles are updated at 09:09 am, while intraday candles with intervals of 1/2/3 minutes are updated starting from 09:15 am.

Alerts are not sent out before 9.15 am. You will need to manually run the scan and view the results with candles, including pre-market values.

Are charts not loading/showing properly?

Please try to reset your chart settings by visiting here: Click here to reset charts(Default).

Why is volume data not available for indices like Nifty and Banknifty?

Indices like Nifty and Banknifty do not have volume data because they are composite instruments of multiple stocks. Indices are calculated based on the price movements of the underlying stocks rather than their volume. Hence, volume data is irrelevant for indices and not displayed on charts and scans.  

Do you have pre-defined scans that we can run?

On our “SCREENER” page, many pre-built screeners are available for use. These screeners can be found on the list and used to start your analysis. You can choose from fundamental and technical screeners according to your preferred strategy. You also search for other scans as well—E.g., breakout stocks, RSI scanners, NR 7 scans…etc.
Here is an example of searched scans – Search for NR7 scans

How to find Shareholding attributes?

You may refer to the dashboard that we have specially made for shareholding patterns(FII, DII and Public) – Industry Shareholding pattern

How can we increase the number of stocks shown in the Atlas dashboard(from 50)?

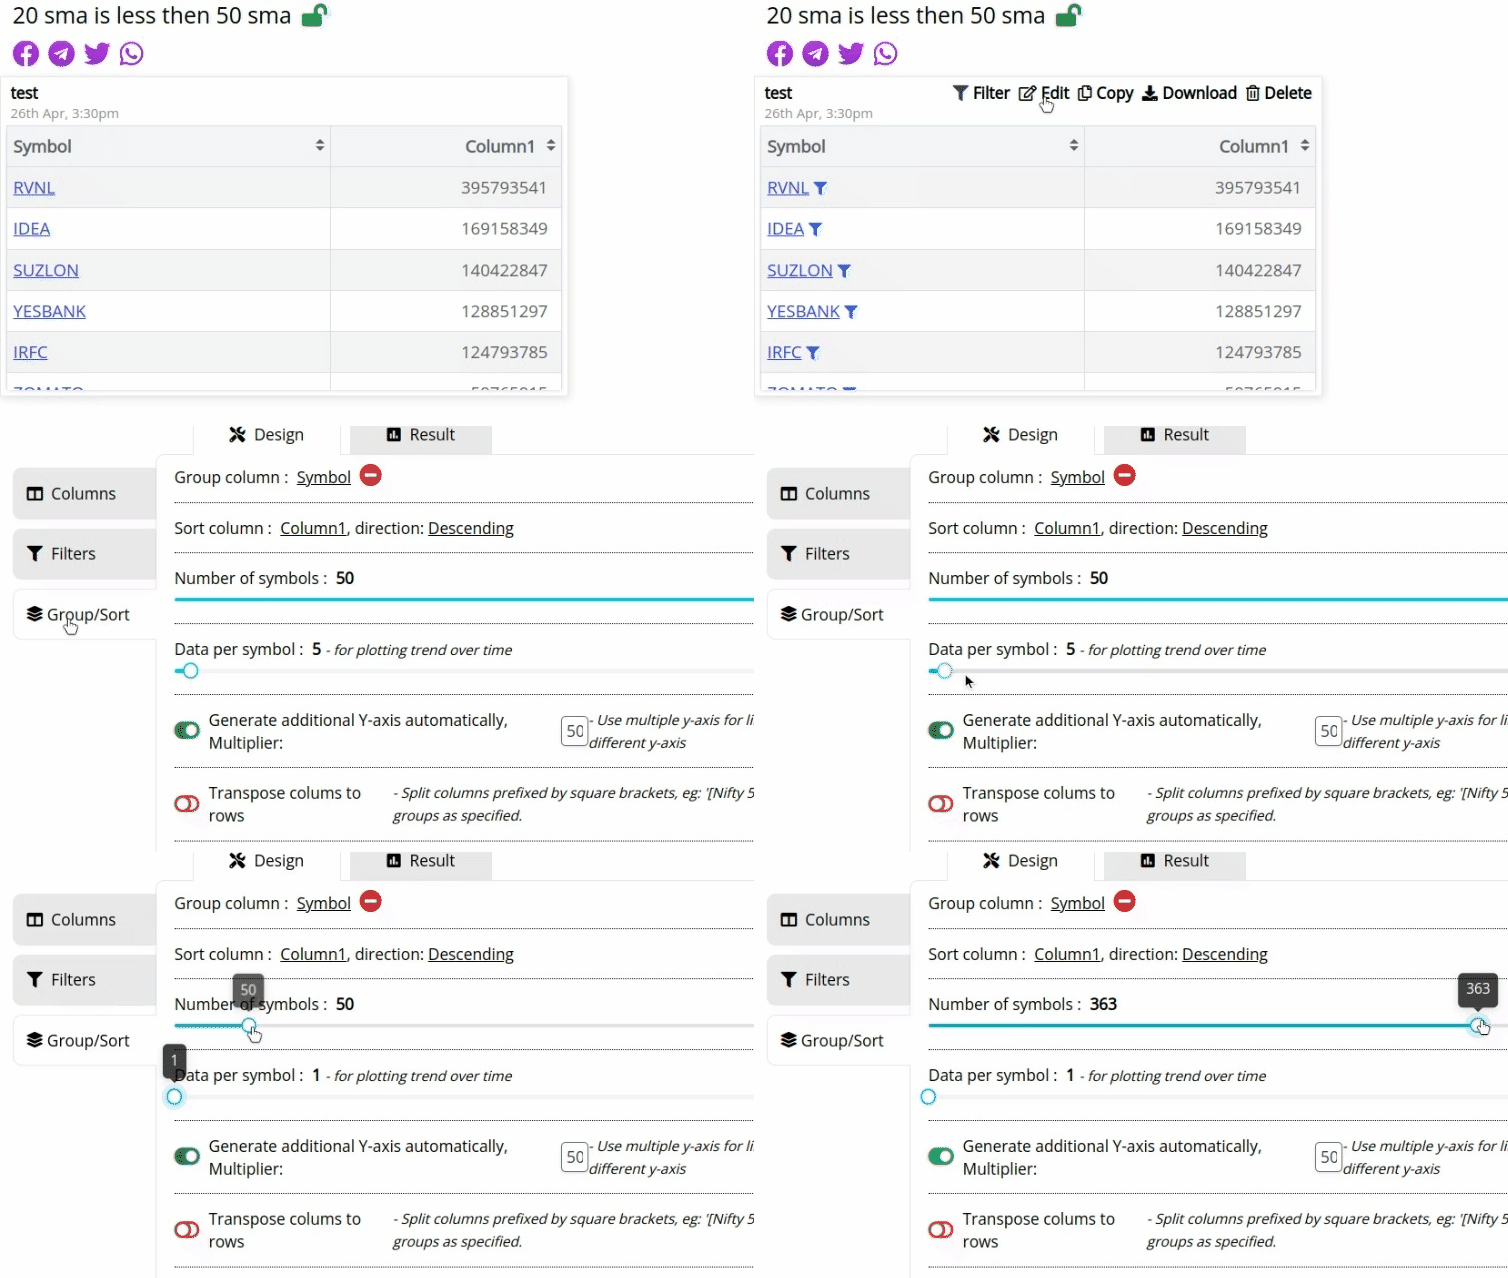
We have set a default stock limit of 50. However, if you wish to increase the number of stocks displayed in your dashboard, please follow these steps:

  1. Open your dashboard and select the ‘Group/Sort’ option.
  2. Drag the ‘Data per symbol’ option from 5 to 1.
  3. After you have made this change, the ‘Number of symbols’ option will appear, automatically set to 50.
  4. You can then drag this option up to 1000 to display more stock results.

Can we set our scans or dashboard as private mode/hidden from others?

Yes, This feature is available to our premium subscription users. It allows users to create scans or dashboards that can be made private, rendering them hidden and inaccessible to others.

You can find this feature located below the ‘submit’ button when you save your scan or dashboard.

Mobile or Desktop Application for chartink?

At this time, Chartink is only available as a web-based application and does not have a mobile or desktop app for Android or iOS devices. However, you can access Chartink on your mobile phone and desktop using a web browser.

Not able to copy-paste scans?

It could be because of usage of the “Custom indicator” used in the scan.
Copy and paste custom indicators used in scanners. To access and utilize the custom indicators used in a scan:

  1. Click on the purple arrow mark (>>) next to the custom indicator.
  2. The formula for the custom indicator will be displayed. Now click on a “copy” of this indicator.
  3. Create a new indicator using this formula by visiting https://chartink.com/indicator and saving the customized formula.
  4. Open a new scan and input the name of the custom indicator in the desired condition.
    Here is a sample video tutorial as a reference – Copy paste scan filters.mp4

Does chartink support mathematical functions?

Yes, Below are a few examples of it:

  1. Abs() – Absolute – Returns the absolute value of an expression/number. For example, using ABS on (5 +(-10) = -5) will return the output as positive (5). Reference dashboard here.
  2. CEIL() – This function returns the smallest integer value, which is bigger than or equal to a number. For example, CEIL on (312.70) will return the output as positive (313). Reference dashboard here.
  3. Floor() – Returns the highest integer less than the given number. For example, using Floor on (521.70) will return the output as positive (521). Reference dashboard here.
  4. ROUND() – The ROUND function rounds a number to a specified number of digits. For example, using Floor on (296.20) will return the output as positive (269). Reference dashboard here.

Can we recover deleted scan in chartink?

Yes, To assist with restoring a deleted scan or widget, it would be helpful to have more information, such as the name and date of deletion. This will allow us to access backups from the appropriate time frame. You can share these details here- [email protected].

Who owns chartink?

The Terms and Conditions of Use set forth herein apply to the website titled chartink.com, which is owned, operated, licensed and controlled by B. Networks.

What are the benefits of chartink premium?

As a premium member, you will have access to dedicated scanner support. This includes requesting custom scans and collaborating on their creation and sharing.
You would be able to:

  • Access realtime data for Charts & Scans every minute
  • Create Alerts and receive updates of stock breakouts over SMS/EMAIL/mobile/desktop/webhooks
  • View charts in 1/2/3 minute timeframes with auto-refresh
  • Run screeners in 1/2/3 minute timeframes with auto-refresh
  • Scan any watchlist via the segment dropdown of a scan
  • Private Scans & Dashboard
  • Customized Atlas dashboards for market overview
  • Dedicated support for your scanner or dashboard requirements

You can get details/signup for our premium service here: https://chartink.com/subscription

Stocks with rising/failling prices and increase in volume

This is a combination of 2 scans, “Stocks with rising prices & increase in volume” & “Stocks with falling prices & Increase in volume”. This example show’s how multiple scans can be combined into a single scan, showing stocks from both of the 2 individual scans.

Notice the use of a new sub-filter, with ANY to specify if either of the 2 filters below it is true.