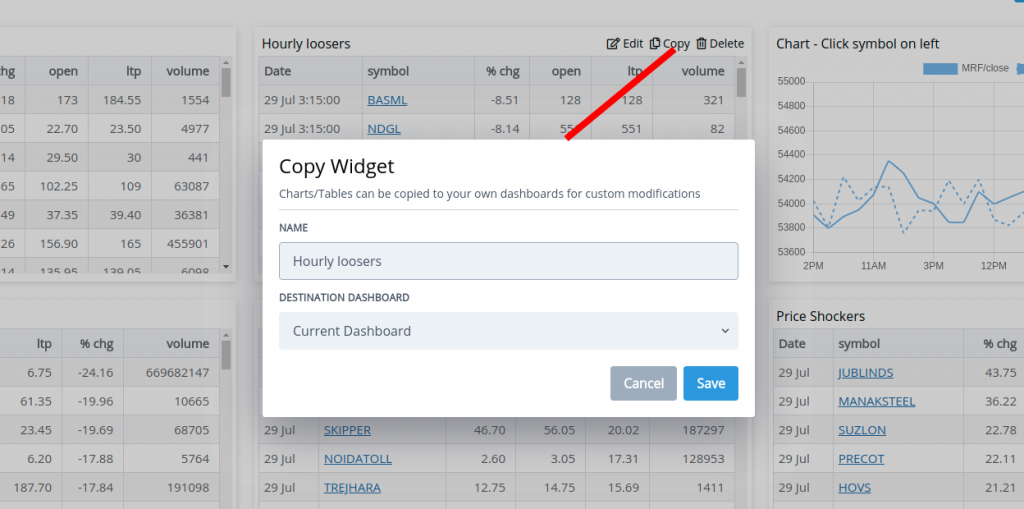
Now copy custom tables/charts from any scanner or dashboard and create your own custom widgets via our “Copy” feature, this allows you to build on existing charts/tables as per your view. Start by coping widgets from our top dashboards here: https://chartink.com/atlas
Widgets can be copied over by clicking on the “Copy” button and selecting the dashboard you’d want to copy to. Custom changes can be made once a widget is copied to your dashboard.
Atlas allows you to view a complete picture of the market on a single screen with auto updates. All dashboards can be customized to show information that you are most interested in, including RSI crossovers, Volume breakouts, Povit points and so on.
Features provided by atlas include:
Customize scan result columns, eg: Adding RSI as one of the result columns
Create new dashboards with custom scans/charts or tables3
Auto updates for premium members
Ability to drill down by clicking on the sector/industry or market cap names3
Sort scan result tables by any columns, like highest RSI, top % change, volume ..etcWe’ve created a few sample dashboards to help you monitor the markets: