Now copy custom tables/charts from any scanner or dashboard and create your own custom widgets via our “Copy” feature, this allows you to build on existing charts/tables as per your view. Start by coping widgets from our top dashboards here: https://chartink.com/atlas
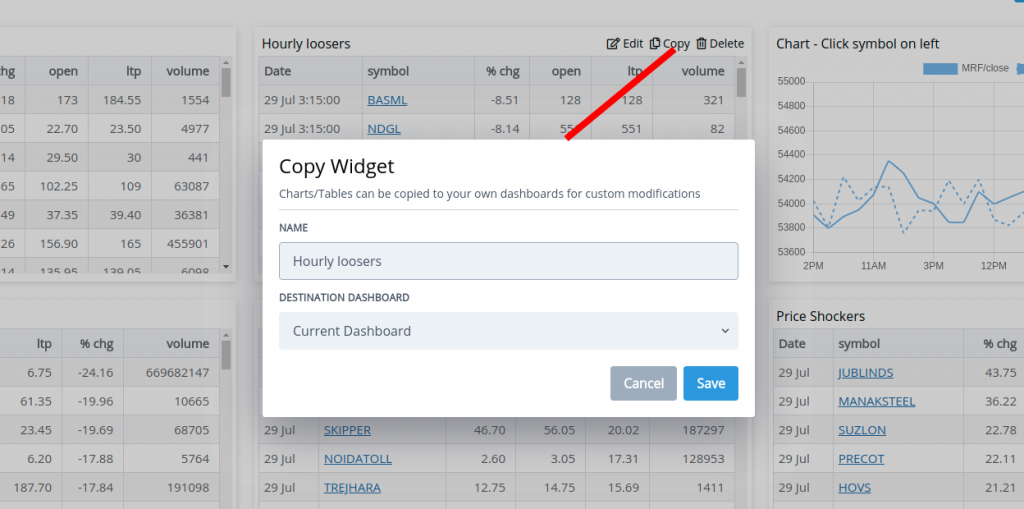
Widgets can be copied over by clicking on the “Copy” button and selecting the dashboard you’d want to copy to. Custom changes can be made once a widget is copied to your dashboard.
Hi Akash
i wish to know whether i can all my screenner to Chartink Atlas dashboard like u have predefind list of screener.
We are working on adding this ability soon
Sir I am premium subscriber of your scanner, I HAVE TWO QUESTIONS-
1) WHY THERE IS NO OPTION FOR MINUTES ,HOURLY OPTION IN MAX ()FUNCTION,ONLY DAILY OPTION IS AVAILABLE.
2)I WANT TO CREATE AB=CD SCREENER IN YOUR SCREENER PORTAL HOW COULD I CREATE THAT?
Hello,
It is possible. We did send you a reply to your email you had sent earlier
SIR I HAVE SENT CALCULATIONS PDF FOR AB=CD PATTERN TO YOUR SUPPORT EMAIL , PLEASE CHECK THAT AND TELL THAT IS AB=CD PATTERN IS POSSIBLE IN CHARTINK SCREENER?
No, currently such a scan in not possible.
I want to join. How can
You can get details/signup our premium service here: https://chartink.com/subscription
As a premium member you would be able to:
Access realtime data for Charts & Scans every minute
Create Alerts and receive updates of stock breakouts over sms/email/mobile/desktop
View charts in 1/2/3 minute timeframes with auto-refresh
Run screeners in 1/2/3 minute timeframes with auto-refresh
Scan any watchlist via the segment dropdown of a scan
Get Dedicated support for your scanner requirements
I want to join.How can
You can get details/signup our premium service here: https://chartink.com/subscription
Premium suscriber; but constantly getting this msg for every scan every time, since 2 days.
“Scanner Under maintenance! Please re-try in 10 minutes.”
Hello,
It seems to be working fine. Are you still facing this issue? Please share a screenshot for the same at [email protected]
Want to download backtesting details in excel format but didn’t find anywhere even I want customized more backtest period as too many scan didnt get result on daily basis but backtest options shows only last 5-6 months results.
Kindly solve the issue asap.
Hello,
Currently we do not have this feature. We do plan on adding it in the near term. Shall keep you posted. Currently backtest displays results upto previous 150 candles (any time frame)
sir in dashboard atlas section i want to add a column of time when the alert popped up. how can i do this…. i want a column for time same as time and date section we see in backtesting.
Currently the only way you can see the triggered time of the alert by clicking on the scan name here: https://chartink.com/alert_dashboard
Can we link two widgets? as in widget A I will run which sector is performing and then when I click on the performing or any sector column then in widget B the stocks should appear as per their performance.
Hello,
Sure, you can create 2 widgets; widget A showing the sector’s performance and widget B showing all stocks. When you click on a given sector from widget A, the 2nd widget would automatically filter stocks from that sector (widget A). Here is an example dashboard for your reference:
https://chartink.com/dashboard/96551
You can click on a specific sector from the 1st widget and accordingly stocks from that sector would be displayed in the 2nd widget. I hope this helps.
Dear Sir,
Not able to move the widgets in my Atlas Dash board as per my desire/requirement after clicking edit lay out button.Please let me advise which way I have to do this action for the movement of different widgets.
Hello,
Please let us know the exact set-up you want for the dashboard. Also, share the link to the dashboard on this email ID: [email protected]
chartink got most of the feature . but one relative strength comparative is missing . please add to compare with index like nifty 50 or 500 .
Hello,
Please note that, as of now, we are working on improving our charts. We don’t want to rush with the feature and give you results based on incorrect data. That is the reason this might take some time. We hope you understand.
plese help me hw to creat startrge any stock evry2% up said $ downsaid
Hello,
We have created the scan. Kindly review.
https://chartink.com/screener/stock-is-2-up
Note: Sorry, but your second query is not very clear. Could you please elaborate more on the same and, if possible, share a sample chart image for reference to this email ID: [email protected]