We have recently released major scanner updates, the post summarizes their usage & benefits:
Drag and Drop filters across groups or re-arrange them across the scan
Duplicate group or a single filter
Copy the filter to clipboard
Count & Countstreak functions
Least & Greatest functions
Drag and Drop filters across groups or re-arrange them across the scan -> Allows to you drag and drop across different groups to make re-oraganinzing a scanner, press left mouse button and drag/move your while the button is pressed to move the filters, sample video below,
Duplicate group or a single filter -> Duplicate a filter or a group by clicking on the copy icon as seen below
Copy the filter to clipboard -> Copy filter text to clipboard by clicking on the “word” icon, as seen below
Count & Countstreak functions -> Helps you to count the total number of times a given filter in the past candles Count eg: ->Filter “Latest count( 50, 1 where latest close > latest upper bollinger band ( 20 , 2 ) ) greater than equal to 2” will return all stocks that have closed above the upper bollinger band for 2 or more days in the past 50 days
Countstreak eg: -> Filter “Latest countstreak( 20, 1 where latest close > latest sma ( latest close , 200 ) )greater than equal to 10” will return all stocks that have continesouly(in a streak) closed above its 200 SMA for the past 10 or more candles(daily timeframe)
Least & Greatest functions -> Helps to get the greatest or the least of a given set of filters
eg: greatest( Latest Open, Latest Close ) will return the greatest value from either the open or the close
We hope these additional features will further simply your scanner creation. If you do have any queries please feel free to leave a comment here or reach us at [email protected]
We’ve added the ability to access any candle of the latest trading day or previous days for Intraday timeframes. Useful for scans that require to access indicator values at a given point in time.
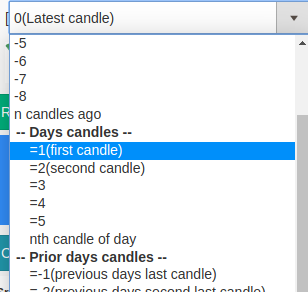
Example offset’s to access different candles for a trading day (5 minute chart)
[0] 5 minute close -> refers to the latest 5 minute candle
[=1] 5 minute close -> refers to the days’ first 5 minute candle
[=3] 5 minute close -> refers to the days’ third 5 minute candle
[=-1] 5 minute close -> refers to the previous day’s last 5 minute candle
[=-75] 5 minute close -> refers to the previous day’s first 5 minute candle, considering a single day has 75, 5 minute candles
If you want to access the first candle on a 5 minute timeframe(9:15-9:19:59am), you can select your required indicator/stock attribute and then change the offset to `=1`as indicated below:
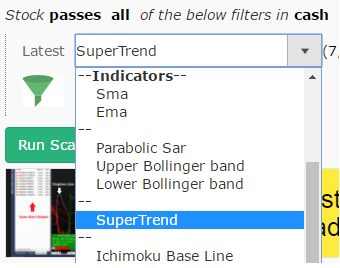
Crossover Support
Days candles also support crossover/below operations. For example, to identify a crossover at the opening candle, we can do “[0] 5 minute Close Crossed above [=1] 5 minute SuperTrend(7,3)”
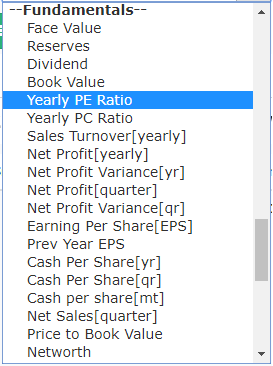
Scans can now be created using a mix of Fundamental & Technical indicators. Fundamental parameters in scan can be validated against our fundamental page.
Example fundamental scans can be found here. We have the following list of fundamental indicators as of now:
Results for Consolidated figures in Rs. Cr.
Face Value
Reserves
Dividend
Book Value
Yearly PE Ratio
Yearly PC Ratio
Sales Turnover[yearly]
Net Profit[yearly]
Net Profit Variance[yr]
Net Profit[quarter]
Net Profit Variance[qr]
Earning Per Share[EPS]
Prev Year EPS
Cash Per Share[yr]
Cash Per Share[qr]
Cash per share[mt]
Net Sales[quarter]
Price to Book Value
Networth
BSE Value in lakhs
NSE Value in lakhs
Market Cap
Operating profit margin[yr]
Operating profit margin[qr]
Gross profit margin
Gross Block
Total Loans
Advance Given By Bank
Net non performing assets
TTM – Trailing 12 months Sales
TTM – Trailing 12 months Operating Profit
TTM – Trailing 12 months Operating Profit margin
TTM – Trailing 12 months Gross profit
TTM – Trailing 12 months Gross profit margin
TTM – Trailing 12 months Net profit
TTM – Trailing 12 months Net profit Variance
TTM – Trailing 12 months EPS
TTM – Trailing 12 months PE
TTM – Trailing 12 months CPS
TTM – Trailing 12 months Depreciation
Fundamental parameters can be added on create scan page after clicking the filter icon
We now offer near real-time NSE updates for Charts & Scans. The data is updated every 5 minutes, the latest update referring current market values. Data is directly fetched from the NSE servers.
Example: If Market opens at 9:15am, on a 5 minute interval the updates can be described as follows:
9:20am – Data from 9:15am – 9:19am
9:25am – Data from 9:20am – 9:24am
9:30am – Data from 9:25am – 9:29am
The minimum data delay would be 0 minutes(eg: at 9:20am) and the maximum would be 5 minutes(eg: at 9:24am)
A segment filter has been added to the topmost filter for modification. These future stock prices are based on NSE cash stocks and indices only. Refer to the below image:
Changing to future stocks
How to run a scan for stocks in the Watchlist?
Click on the segment filter at the top of the screener page, and select “Watchlist” from the dropdown menu. The scan will then be run for the stocks in your Watchlist. You can create your new watchlist here
How to perform Weekly/Monthly scans?
After an indicator/attribute has been added, click on the “Latest” prefix right before it and change it to any of the “Weekly” range groups, e.g., “Weekly”, “1 week ago,” and so on… The same applies to Monthly filters –
How to run Intraday timeframe scans?
After you have added an indicator, you can click on the “latest” prefix on the left-hand side and change it to the Intraday timeframe you want. E.g.:
Intraday offsets
In a premium subscription, you can access 1/2 and 3-minute timeframes. Whereas in a free version, timeframes are from 5 minutes onwards
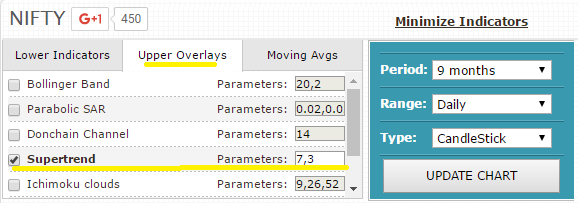
How to add indicators on charts?
Navigate to the chart of the stock you want to analyze.
Select the “Indicators” button on the left side of the chart. To add an indicator to a chart, follow these steps:
Scroll through the list of available indicators and select the one you want to add to the chart. Once you open a chart, the left side has an option for indicators; you can select an indicator per your preference.
Adding SMA’s indicator on the chart’s
How to use the crossed above/below functions correctly?
The crossover function is primarily designed for use with indicators such as the MACD line crossing the MACD signal or the EMA20 crossing the EMA50, and in such cases, it works effectively.
However, when applied to attributes like a 5-minute close crossing the high of 1 day ago or even for the fixed candle offset, like the current 5-minute close crossing [=1] 5-minute high (day’s first candle high). The crossover function may not deliver accurate results. This is because it compares two different timeframes—5-minute (intraday) and the daily candle (from 1 day ago) leading to incorrect outcomes.
Crossover on different timeframe(INCORRECT) –
Fixed candle Cross-over(INCORRECT) –
In such scenarios, the appropriate approach would be to use ‘greater than’ and ‘less than’ conditions. Below is the modified version of the scan to reflect this. Below is an example scanner –
Cross over using Greater than and Less than(CORRECT)
Do you show or add Pre-Market data?
Pre-market data for the current day is available at 9:09 am and includes data up until 09:08:59 am. Our scans for daily, weekly, monthly, quarterly, and yearly candles are updated at 09:09 am, while intraday candles with intervals of 1/2/3 minutes are updated starting from 09:15 am.
Alerts are not sent out before 9.15 am. You will need to manually run the scan and view the results with candles, including pre-market values.
Why is volume data not available for indices like Nifty and Banknifty?
Indices like Nifty and Banknifty do not have volume data because they are composite instruments of multiple stocks. Indices are calculated based on the price movements of the underlying stocks rather than their volume. Hence, volume data is irrelevant for indices and not displayed on charts and scans.
Do you have pre-defined scans that we can run?
On our “SCREENER” page, many pre-built screeners are available for use. These screeners can be found on the list and used to start your analysis. You can choose from fundamental and technical screeners according to your preferred strategy. You also search for other scans as well—E.g., breakout stocks, RSI scanners, NR 7 scans…etc. Here is an example of searched scans – Search for NR7 scans
How to find Shareholding attributes?
You may refer to the dashboard that we have specially made for shareholding patterns(FII, DII and Public) – Industry Shareholding pattern
How can we increase the number of stocks shown in the Atlas dashboard(from 50)?
We have set a default stock limit of 50. However, if you wish to increase the number of stocks displayed in your dashboard, please follow these steps:
Open your dashboard and select the ‘Group/Sort’ option.
Drag the ‘Data per symbol’ option from 5 to 1.
After you have made this change, the ‘Number of symbols’ option will appear, automatically set to 50.
You can then drag this option up to 1000 to display more stock results.
Can we set our scans or dashboard as private mode/hidden from others?
Yes, This feature is available to our premium subscription users. It allows users to create scans or dashboards that can be made private, rendering them hidden and inaccessible to others.
You can find this feature located below the ‘submit’ button when you save your scan or dashboard.
Mobile or Desktop Application for chartink?
At this time, Chartink is only available as a web-based application and does not have a mobile or desktop app for Android or iOS devices. However, you can access Chartink on your mobile phone and desktop using a web browser.
Not able to copy-paste scans?
It could be because of usage of the “Custom indicator” used in the scan. Copy and paste custom indicators used in scanners. To access and utilize the custom indicators used in a scan:
Click on the purple arrow mark (>>) next to the custom indicator.
The formula for the custom indicator will be displayed. Now click on a “copy” of this indicator.
Open a new scan and input the name of the custom indicator in the desired condition. Here is a sample video tutorial as a reference – Copy paste scan filters.mp4
Does chartink support mathematical functions?
Yes, Below are a few examples of it:
Abs() – Absolute – Returns the absolute value of an expression/number. For example, using ABS on (5 +(-10) = -5) will return the output as positive (5). Reference dashboard here.
CEIL() – This function returns the smallest integer value, which is bigger than or equal to a number. For example, CEIL on (312.70) will return the output as positive (313). Reference dashboard here.
Floor() – Returns the highest integer less than the given number. For example, using Floor on (521.70) will return the output as positive (521). Reference dashboard here.
ROUND() – The ROUND function rounds a number to a specified number of digits. For example, using Floor on (296.20) will return the output as positive (296). Reference dashboard here.
Can we recover deleted scan in chartink?
Yes, To assist with restoring a deleted scan or widget, it would be helpful to have more information, such as the name and date of deletion. This will allow us to access backups from the appropriate time frame. You can share these details here- [email protected].
Who owns chartink?
The Terms and Conditions of Use set forth herein apply to the website titled chartink.com, which is owned, operated, licensed and controlled by B.Networks.
What are the benefits of chartink premium?
As a premium member, you will have access to dedicated scanner support. This includes requesting custom scans and collaborating on their creation and sharing. You would be able to:
Access realtime data for Charts & Scans every minute
Create Alerts and receive updates of stock breakouts over SMS/EMAIL/mobile/desktop/webhooks
View charts in 1/2/3 minute timeframes with auto-refresh
Run screeners in 1/2/3 minute timeframes with auto-refresh
Scan any watchlist via the segment dropdown of a scan
Private Scans & Dashboard
Customized Atlas dashboards for market overview
Dedicated support for your scanner or dashboard requirements
Starting 2017, Chartink.com launched custom technical stock screener for NSE/Indian Stock markets. Our screener lets you fully customize & build custom stock scans. So, if you are looking for any technical breakouts or automate your buy/sell signals our scanner can help. Start using it today for free.