Near real-time updates

We now offer near real-time NSE updates for Charts & Scans. The data is updated every 5 minutes, the latest update referring current market values. Data is directly fetched from the NSE servers.

Example: If Market opens at 9:15am, on a 5 minute interval the updates can be described as follows:

  • 9:20am – Data from 9:15am – 9:19am
  • 9:25am – Data from 9:20am – 9:24am
  • 9:30am – Data from 9:25am – 9:29am

The minimum data delay would be 0 minutes(eg: at 9:20am) and the maximum would be 5 minutes(eg: at 9:24am)

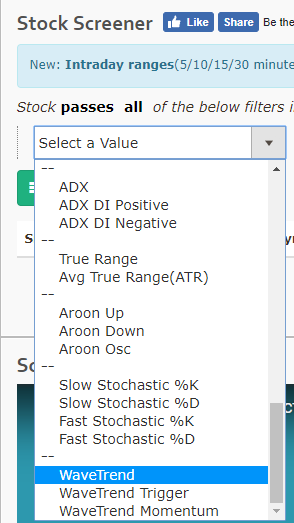
WaveTrend indicator updates

WaveTrend indicator is now available in our Charts & Screener. It can be added for Intraday, daily, weekly & monthly ranges and accepts 3 parameters as below:

  1. Calculation period: number of candles used to calculate WaveTrend, defaults to 10
  2. Averaging period: number of candles used to average WaveTrend, defaults to 21
  3. Momentum Length: number of candles used to calculate WaveTrend momentum, defaults to  4

Refer the below images on how to add them to your studies.

  1. CHARTS

  2. SCANNER