Filter stocks that are either overbought(crossed below 70) OR oversold(crossed above 30) in a single scan.
Steps to find Overbought OR Oversold stocks:
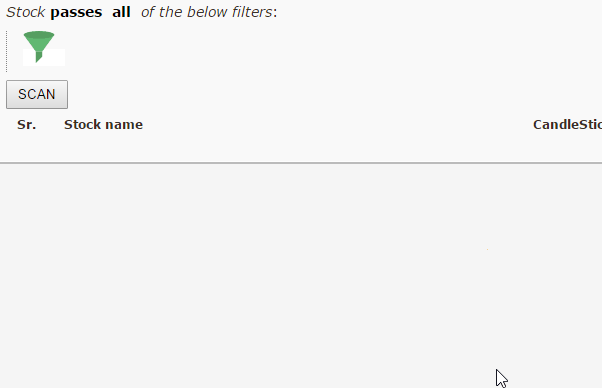
- As we want to filter stocks that have filtered either of the filters(overbought or oversold filter), click on the ‘All’ keyword, and change it to ‘Any’ from the first sub-filter.
- Click on the funnel(
 ) and select the RSI indicator from the pull-down menu.
 - Select the offset(Latest) and specify the duration (which is by default 14 days for RSI). You can change both the offset and the duration as per your requirements by clicking on them.
- Click on the next icon(…) and select the ‘Crossed above’ operation, as we want to find out the oversold stocks crossing above 30 (meaning RSI having a value below 30 for the past day but above 30 for today).
- The number constant selected by default is 50, which is changed to 30 for oversold stocks.
- Repeat steps 2-5 for a “crossed below” operation & comparing it against a value of 70
- Run the scan by clicking on ‘Run Scan’ button.
Pls. include some adjustments to find low volatility breakouts.
Hi
Suppose I m trying to Dec decide on stocks during preopen market. Can I use rsi greater than 70 or less than 30
You’ll get pre-market data for current’ day’s data starting at 9:09am, consisting of data until 9:08:59am. Data is updated at 9:09am in our scans for our Daily candles
For RSI crossovers, Below is an example stocks for stocks crossing above RSI 70:
https://chartink.com/screener/rsi-crosses-above-70-2
Hi,
want to know how how I can use average on RSI ? For example I want filter stock which r closing below 14 day average of 14 days RSI. Kindly guide me.
Thanks.
Hello,
You mean EMA of RSI? Below is an example scan for the same:
https://chartink.com/screener/9-sma-price-45-ema-and-rsi-9-sma-rsi-45-ema
can we have indicator of rsi of OBV
THANKS IN advance
Currently this would not be possible.
Anyone plz help me, i don’t know how to use scanner can u plz guide me
Hello,
You may view tutorials on scans and alerts here:
https://chartink.com/articles/scanner/scanner-user-guide/
To set alerts for a scan, you need to click on “create alert” after opening the scan page and set your alert preferences accordingly.
https://chartink.com/articles/alerts/alerts-guide/
https://chartink.com/articles/alerts/desktop-mobile-a-k-a-web-notifications/
https://chartink.com/articles/alerts/webhook-support-for-alerts/
You can also start by reviewing our top scans here: https://chartink.com/screeners/top-loved-screeners
They contain the top 10 scans used for Intraday/Swing & short term trading
If you need help in creating a scan, please share your requirements, we shall create the same for you.
This is a great app. can we filter only nifty50 or sector wise stocks.
Hello Ram,
Yes, you can change the scanner segment. You will see this option on top of the scanner as stock passes all below filter in “Cash” when you click on the cash, you can be able to change the scanner segment. Currently, we have nifty50 stocks as default and not for other sectors. However, we may plan on adding it in the near term & l shall keep you posted on this.
The other alternative is to create a custom watchlist by adding sectoral stocks to the watchlist and running those watchlists against your scanner; You may create a watchlist here (https://chartink.com/watchlist/create).
Can I have your contact number please?
I want to clarify some details like have you have any app to scan rsi oversold and overbought and how will get the alert.
Hello,
We provide support only via email, as it makes it simpler for us to understand your requirements & have them documented.
Yes, you can write a scan to check for stocks that are overbought or oversold based on RSI. Here is an example scan:
https://chartink.com/screener/rsi-overbought-oversold-40
This checks for the RSI to be either above 70 or below 30.
How can I put RSI crossed above 60 in monthly chart
Hello,
Here is your scan; kindly review it :
https://chartink.com/screener/monthly-rsi-crossed-baove-60
hello sir, i have require of rsi coding as same as chartink.com website. because i want to use in crypto market.
Hello, We currently support only NSE cash stocks and indices; we plan to add Global stocks and cryptocurrencies too shortly.