Webhook support for Alerts

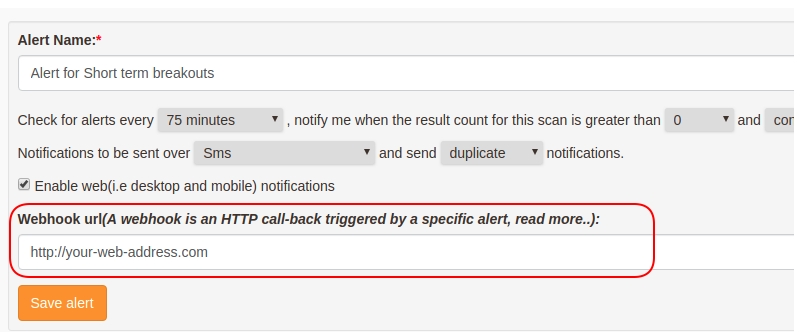
We’ve added the ability to add webhook’s for your alerts. A webhook is an HTTP call-back triggered by a specific event(in our case a alert), these can be used by your own application to monitor, place automatic orders.. etc. You can add webhooks for any given alerts by entering the URL for your web address(prefixed by http, https), this can be done by clicking on “Create/Modify Alert” right below your scans:
SAMPLE Post Data(json)
{
    "stocks": "SEPOWER,ASTEC,EDUCOMP,KSERASERA,IOLCP,GUJAPOLLO,EMCO",
    "trigger_prices": "3.75,541.8,2.1,0.2,329.6,166.8,1.25",
    "triggered_at": "2:34 pm",
    "scan_name": "Short term breakouts",
    "scan_url": "short-term-breakouts",
    "alert_name": "Alert for Short term breakouts",
    "webhook_url": "http://your-web-hook-url.com"
}

Webhooks will triggered along side your alert settings, eg: sending alerts over Email/SmS/Desktop would continue as normal

Note on automating trades with webhooks, requires some programming logic so that you can incoporate our webhooks within your application which is alreadying using API’s from the stockbrokers to place orders. Your system/application must be deployed on the internet and reachable by a domain or a IP address, this requires your application to support the ability to receive incoming POST request‘s so that we can send our JSON data for the alert

We recommend using a service like Hookbin to test the webhooks feature, it allows you to create a endpoint, which you can add in our “webhook url” field within the alert form. An HTTP POST request will be made to the URL you have specified along with the data corresponding to the alert.

Change colors for table columns, line, bar and Pie charts

We’ve released support to change/customize colors for widgets, including table colors for table columns, line, bar and pie charts. Below is a demo showing the process to change colors:

Customizing colors as per your needs would help you easliy identify the levels/columns that interest you first. Color changes can be made to Tables as well any types of Chart(pie/line/bar/area).


Now create your own Custom Indicators !

We’ve recently added the ability to create your own custom/derived indicators using existing indicators.

For example, you may have your logic of HLC3 as is “high  + low + close / 3” & would want to use this across multiple filters in different/same scans/widgets. Until now, you’d need to copy/write the logic whereever it would required.

With “custom indicators”, you can simply define its logic as:

HLC = ( current candle high + current candle low + current candle close ) / 3

Here’s the custom indicator for the above logic: https://chartink.com/indicator/hlc3

The above created indicator can then be used to create new scans/widgets: https://chartink.com/screener/close-above-hlc3 (notice the HLC indicator selection)

These are similar to having a value saved in a variable/temp working space and then using it across in multiple scans. Note, while using it across scans, you can select the timeframe for its calcuation, eg: Daily/Weekly/Monthly or Intraday candles giving you further flexibility.

To access a previous candle for a given timeframe, you can select “1/2.. candles ago”.

Below is another example from one of our users:

EOM – CUSTOM INDICATOR LOGIC
Scan using SMA on EOM(custom indicator)https://chartink.com/screener/eom-greater-than-20