Filter stocks that have seen an sudden rise in their volume by over 5x times the average volume over the past 10 trading sessions and have gained more than 5% today.
Updates, Tutorials & News
Filter stocks that have seen an sudden rise in their volume by over 5x times the average volume over the past 10 trading sessions and have gained more than 5% today.

Scan stocks where the 50 Simple moving average(SMA) has crossed below the 200 Simple moving average . “Crossed below” specifies that the 50 SMA was above the 200 SMA a day prior, but has closed below it today.
Scan stocks where the 50 Simple moving average(SMA) has crossed above the 200 Simple moving average . “Crossed above ” specifies that the 50 SMA was below the 200 SMA a day prior, but has closed above it today.
MACD bullish and bearish breakouts, showing MACD Signal crossing above & below MACD line using the default parameters of (26,12,9)
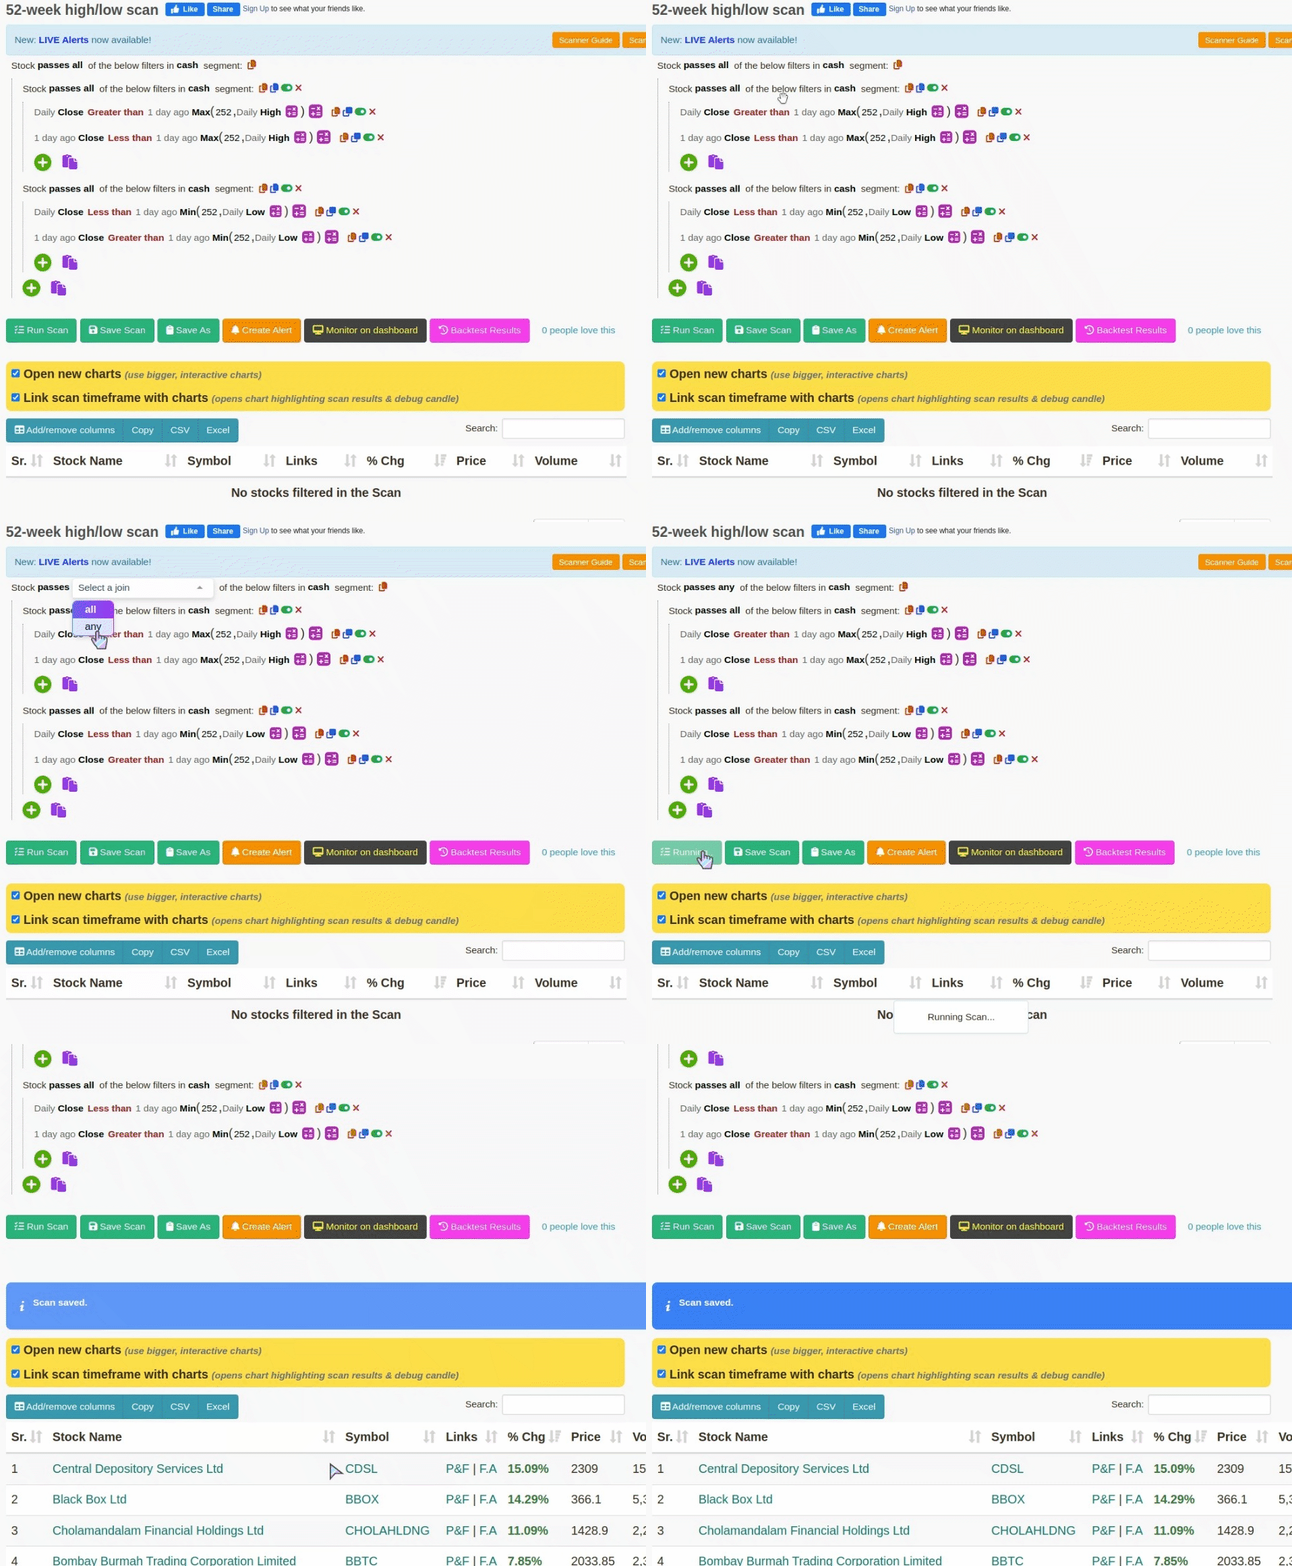
Scanning stocks that have touched their 52-week high OR 52-week low, 52 weeks consists of 252 trading days. We’ll be using our Min/Max functions with a duration of 252 days, along with the “high/low” stock attribute, to filter such stocks.
Scanner: 52-week high/low scan
Scan stocks that have opened Gapup OR Gapdown from their yesterdays close. A stock passes these filters if it has opened 3% higher OR 3% lower when compared with its previous day close.
Williams %R ranges from 0 to -100, we search for stocks that are in the oversold(-80) region OR overbought(-20) region. Both Overbought & Oversold filters are matched via the “ANY” sub-filter condition in a single scan
Filter stocks that are either overbought(crossed below 70) OR oversold(crossed above 30) in a single scan.
 ) and select the RSI indicator from the pull-down menu.
List stocks that have their RSI(14 day) change its zone from “below/equals” 30 yesterday to “above’ 30 today(crossed above 30), indicating they are likely to see an upmove ahead.
 ) and select the RSI indicator from the pull-down menu.