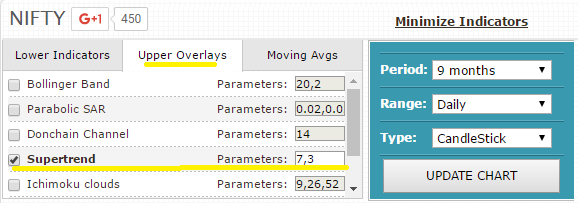
Supertrend indicator is now available in our Charts & Screener. It can be added for daily, weekly & monthly ranges and accepts 2 parameters as below:
- Period – Period used for ATR calculation, default: 7
- Multiplier – Co-efficient used in calculation, default: 3
Refer the below images on how to add them to your studies.
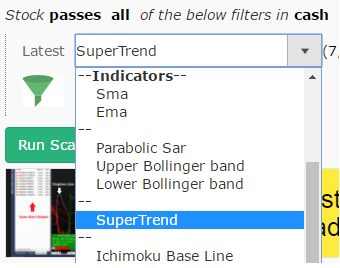
Screeners for Supertrend
Hoping this additional further helps you to filter & find breakout stocks.
Lot of thank for fastest respond.
I request for super trend and the same has been add with in 10 days by chart ink team…Thax for fast responding an providing great support
A request placed in 2013 has come true in 2017.Good Job team.Please add more parameters like 10 1 10 2 10 3 7 1 7 2 7 3 for super trend in screener.
Thanks a lot for responding request
Hi,
Please introduce Triple Exponential Moving Average (TEMA) for scanning/screening in addition to Exponential Moving Average (EMA). Thank you,
Regards
Vishnu
We shall add that soon
How to add time period to this supertrend chart?
Is it possible to define the market cap?
You can change the parameter to the supertrend indicator to any value that you want. Market cap is not yet available
what is the code for stocks which are making highs for 3 days and lows for 3 days
am sorry, I got the code from your example given in the screener. thanks a lot
I request for super trend and the same has been add with in 10 days by chart ink team…Thax for fast responding an providing great support
Thanks Chartlink for the wonderful job. Really appreciate the initiative. Is it possible to find out an moving average which has remained steady (may be within a range of 2%) like a straight line say for 5/7/10 days?
Best Regards
Bharat Thakkar
As of now, you would need to add multiple conditions for all the moving averages with different offsets, 5/7 to get your desired results
I really appreciate the logical break-up of the technical parameters
& making it so flexible & comprehensive to include so many parameters & sub-parameters.
Very nice indeed.
Thank you sir,
K C Arvind
seeing the comments now, you can instead of limiting it to
technical parameters screening expand to add fundamental
& ratio calculations too….basically increasing its scope. But
its worth it, since there arent many good and comprehensive
screeners like one of DSJ. All the best.
K C ARvind
Thanks for your feedback. Yes, we shall be adding financial parameters soon too
Dear Akash ji,
Would please add “Heikin Ashi” tool and other round mark tool & Rainbow walk index ?
Thank you!!
Dear Admin,
i am finding difficulties in filtering, i am looking my filter like this 20 SMA 5% >= 50 SMA , 50 SMA >= 100 SMA
We have many such examples for stocks near SMA/Highs, I’ll suggest you review thru them here: http://chartink.com/screeners/search?search_term=near
scanner work only live market?
It works for Intraday with live data as well and EOD
The data is delayed for 15 minutes, then how shall it work on 5 minutes chart?
We provide near real-time data updates, please refer here: http://chartink.com/articles/scanner/near-real-time-updates/
Please add hull moving average too…
Supertrend is not working for more than 100 period e.g Supertrend(101,3) or Suptertrend(110,3) .
Kindly check on it.
I am referring to the scanner for intraday/Daily/Weekly in which Supertrend is not working for more than 100 period e.g Supertrend(101,3) or Suptertrend(110,3) .
Kindly check on it.
cOULD u pls add breakout indicators similar to this website
http://www.topstockresearch.com/TrendLine/ResistanceBreakout.html
Is it possible to apply Heikin ashi candle stick pattern in this screener
I am regular user of chartink.com, and I loved these filters. One query i have regarding Supertrend.
If I want to scan stocks whose “Hourly (60 mins) supertrend turned positive”.
Supertrend either show positive or negative, so I want to apply this logic.
Query should be:
Weekly Supertrend (7,3) = Positive
Hourly SuperTrend (10,3) – Cross Above (Turn to Positive).
Is there any way???
Hello,
Here is an example scan. A kindly review will it work for you or not?
https://chartink.com/screener/supertrend-turn-possitive-or-supertrend-turns-red-to-green-for-hourly-timeframe
Dear Sir,
Kindly let me know how can I calculate Super Trend manually. I am getting difference in calculation by Upstox & Chartink.
Thanks.
Kaushik Sangoi
Hello,
Could you please share the formula for Supertrend that you are verifying this against?
Not able to 2nd supertrend in charts. If I make a scanner the 2nd supertrend is not shown? Can you help?
how we can create adeptive moving average scanner on chartink on daily candel
Greetings!
At this moment, we do not offer the feature you mentioned (Adaptive moving average). Nonetheless, we are actively exploring the option of adding it along with new indicators.
I am unable to provide a specific timeline for the addition of this feature, but I have forwarded your request to our Development team for future consideration.
We value your patience and look forward to enhancing our service for our valuable users.
Dear Sir
Kindly help out for the below requirement.
Latest candle’s Midpoint has to hold for next 2 bars.
For example – If PIN bar – Formed, Next 2 candlesticks has to hold the midpoint of this pin par.
Kindly share the code for this.
Hello,
Sure, we can create the scan for you. Can you please share an sample chart image highlighting the same, as it would be easy for us to create the scan? Also, can you please let us know if you want bearish or bullish PIN bar.
Dear sir
This is the link
https://chartink.com/stocks/godrejcp.html
Date 9-10-2023 Time 3.15 1st candle formed.
Next 2 candles(10-10-2023) (9.15 & 10.15) – hold the midpoint of 3.15 candles.
Kindly do the needful.
Hello,
We have created the scan. Kindly review.
https://chartink.com/screener/pinning-bar-holding-for-next-to-candles-hourly-time-frame
Note: It seems that a pin bar was formed two candles ago, but you haven’t specified whether it was bullish or bearish, so we’ve considered both possibilities. Our scan indicates that for the next two candles, the midpoint of the pin bar candle has not been breached. The stock GODREJCP is showing in the back test of scan on 10/10/2023 at 10:15 AM.
Thanks lot sir for your assistance.
Kindly advice about the premium version
. How to learn about chartink coding , any tutorial available sir.
Hello,
Your welcome. Below are the benefits of being a premium user. Kindly review.
As a premium member, you would be able to:
Access real-time data for Charts & Scans every minute
Create Alerts and receive updates of stock breakouts over SMS/email/mobile/desktop/webhooks
View charts in 1/2/3 minute timeframes with auto-refresh
Run screeners in 1/2/3 minute timeframes with auto-refresh
Scan any watchlist via the segment dropdown of a scan
Private Scans & Dashboard
Customized Atlas dashboards for market overview
Dedicated support for your scanner or dashboard requirements
You can get details/sign up for our premium service here: https://chartink.com/subscription
Please review our guide here: https://chartink.com/articles/scanner/scanner-user-guide/
thanks sir. Will join premium
Hello,
You’re welcome and thank you for the consideration.