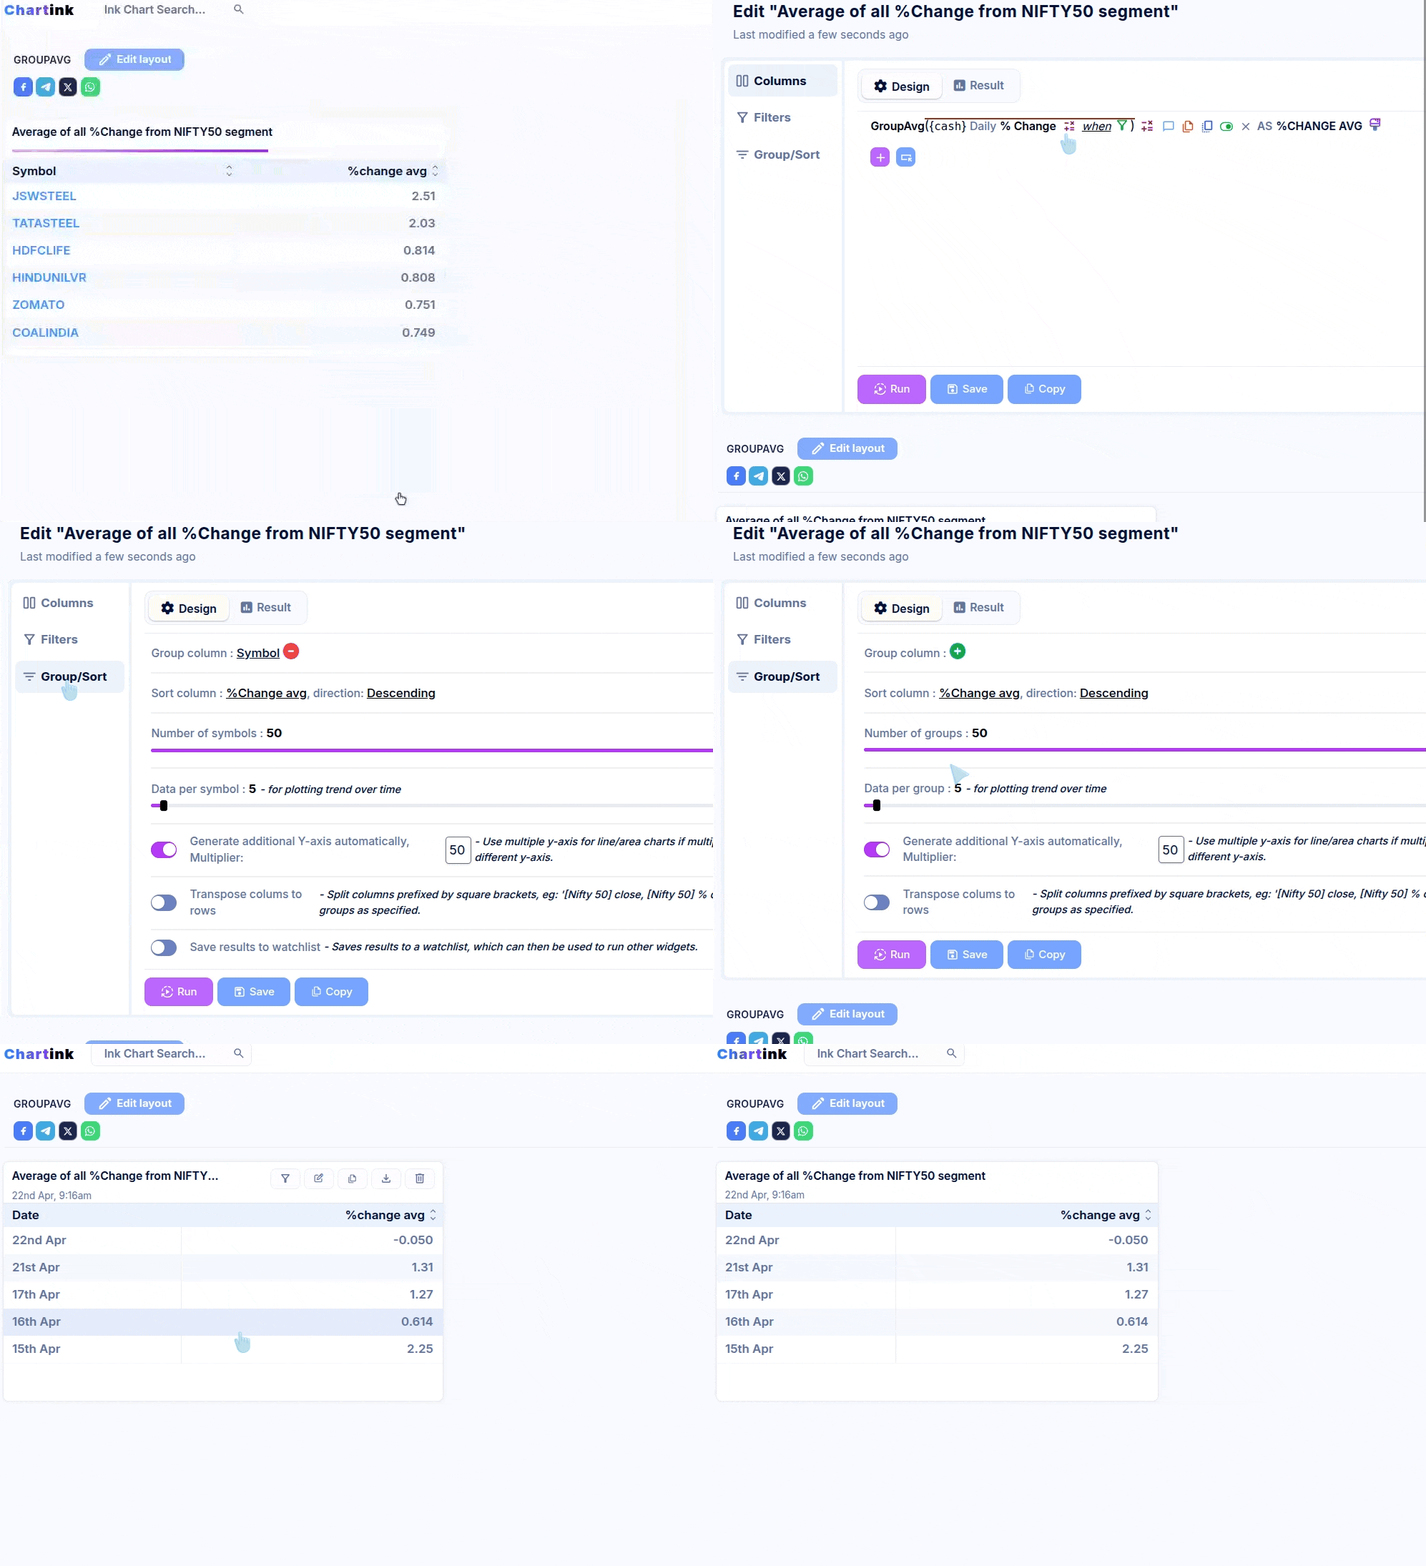
The Group functions enable traders to analyze stock movements by organizing data based on specific conditions for a group like Nifty 50 or Nifty 500 stocks. This makes it easy to quickly extract valuable insights, such as counts, highs, lows, averages, and totals.
- GroupCount: Counts the number of entries from a group that fulfill a given condition.
Tutorial – Video GroupCount
Dashboard – Dashboard for GroupCount
- GroupHigh: Finds the highest value of an attribute or indicator from a group for a given condition.
Tutorial – Video GroupHigh
Dashboard – Highest high in NIFTY50 segment. - GroupLow: Finds the lowest value of an attribute or indicator from a group for a given condition.
Tutorial – Video GroupLow
Dashboard – Lowest %Change in NIFTY50 segment - GroupAvg: Calculates the average of a given attribute or indicator from a group for a specific condition.
Tutorial – Video GroupAvg
Dashboard – Average of %Change in NIFTY50 segment - GroupSum: Calculates the sum of a given attribute or indicator from a group for a specified condition.
Tutorial – Video GroupSum
Dashboard – Sum of all Close price of Green candles in NIFTY50 segment
For the above explanation, we have created an example dashboard showcasing the ‘Group Function‘.
Please note, it is necessary to remove the “Grouping” from Group/Sort menu for using the grouping conditions mentioned above.
