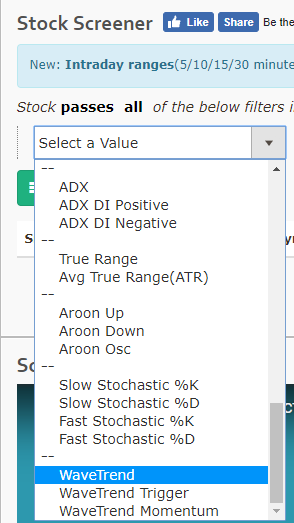
WaveTrend indicator is now available in our Charts & Screener. It can be added for Intraday, daily, weekly & monthly ranges and accepts 3 parameters as below:
- Calculation period: number of candles used to calculate WaveTrend, defaults to 10
- Averaging period: number of candles used to average WaveTrend, defaults to 21
- Momentum Length: number of candles used to calculate WaveTrend momentum, defaults to 4
Refer the below images on how to add them to your studies.


Hi Akash,
thanks for wonderful work. can you please have an option to have OR clause between two condition.
thanks, ankit
if hull moving average is included means it will be superb
Dear sir
I am retail investor, My candlestick research indicators most comes in BSE Chart & Missing lots of X group stocks So please Kindly update BSE & X group stocks to scan option by EOD……………….
Thank you sir…….
Outstanding charting real time with deserving indicator
How to interpret the indicator in your chart ?
Dear Sir,
Please you can do WAVE TREND STRATEGY
buying volumes can rise past 2 days.
You need volume rising since 2 days and what condition for wavetrend?
yes sir.
Below is your scan:
https://chartink.com/screener/wavetrend-crosses-above-wavetrend-trigger-and-volume-increasing-since-2-days