Introducing Relative Strength(RS)

Relative Strength (RS) compares a stock’s price performance with a benchmark index (such as the NIFTY 50) to determine whether the stock is out-performing or under-performing the broader market.


What Relative Strength Actually Measures

Relative Strength compares:

  • A stock’s price performance
  • Against the market index (like NIFTY 50)

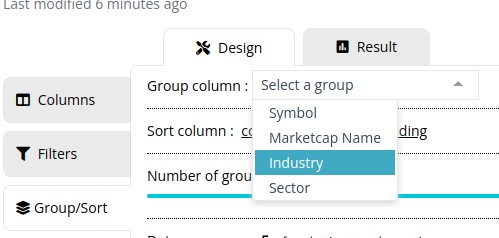
How to use Relative Strength in Chartink

For example RSI indicator:

  • A stock may show weakness on its own(RSI below 20)
  • While the market remains relatively strong(RSI above 20)

Example scan: Stocks under-performing NIFTY

This image has an empty alt attribute; its file name is chrome-capture-2025-12-30-3.gif

Relative Strength Formula with Example

One practical way to measure Relative Strength is by comparing the RSI (Relative Strength Index) of a stock with the RSI of the benchmark index.

Formula: Relative Strength (RS) = Stock RSI − Index RSI
Example Dashboard: TCS x NIFTY

Using the example data:

  • Stock (TCS) RSI: 55.30
  • Index (NIFTY) RSI: 48.93
  • RS(TCS x NIFTY): +6.37 (The benchmark RSI, not a derived value.)

Since the Relative Strength value is positive, it indicates that TCS is performing better than the NIFTY index at that time.

If Stock RSI > Index RSI → Relative Strength
If Stock RSI < Index RSI → Relative Weakness


Relative Strength Using 52-Week Price Performance

Relative Strength can also be calculated using 52-week price performance, which is commonly used for medium- to long-term stock selection.

This approach normalises a stock’s price performance against the index over the same period.

Formula (52-Week Performance-Based RS)

Relative Strength (RS) = (Stock Close ÷ Stock Close 52 Weeks Ago) ÷ (Index Close ÷ Index Close 52 Weeks Ago) − 1

Example scan: Stock with RS positive w.r.t NIFTY 50
Chart Snapshot: Relative strength on Chart

How to Interpret 52-Week RS

  • RS above 0 → Stock has outperformed the index
  • RS below 0 → Stock has underperformed the index

Relative Strength Using 5-Day Performance Ranking vs NIFTY

This is another method of applying Relative Strength (RS), where stocks are ranked based on their price out-performance versus NIFTY over the last 5 trading days.

Example Dashboard: Top-10 stock Outperform stocks


Relative Strength comparisons must use the same indicator and timeframe for both the stock and the index.

  • Stock RSI vs Index RSI → ✅
  • Stock 15 minute MACD vs 15 minute Index MACD → ✅
  • Stock Close vs Index Close → ✅
  • Stock RSI vs Index MACD → ❌ not logically correct
  • Stock RSI (Daily) vs Index RSI (15-min) → ❌ not logically correct

Only the instrument should differ (stock vs index); the measurement method must remain identical.


Introducing Xpress Indicator

Chartink has always focused on making technical analysis easier to use—without compromising on depth. With the same objective, we’re introducing Xpress Indicator: a new indicator-generation engine that lets you turn complex indicator logic into a usable Chartink indicator in minutes.

Quick Video on Youtube

Why Xpress Indicator Was Needed

Many real-world trading indicators rely on logic that goes beyond standard indicators like SMA/EMA or simple counting conditions. They often involve multi-step calculations, custom rules, and conditional flows.

Earlier, converting such logic into a usable Chartink indicator typically required manual rework or approximation—which could unintentionally change the original strategy’s intent.

Xpress Indicator is built to close this gap.


What You Can Submit

The generator accepts indicator logic in multiple formats as mentioned below:

  • Source code
    Example: Logic / Script of the indicator.
  • Formula-based logic
    Example: Excel-style formulas, Pseudo-code and Mathematical descriptions.
  • Articles describing the logic
    Example: A blog or note explaining how the indicator identifies trends or reversals.
  • Plain English description
    Example: Step-by-step explanation of the logic or Rules describing how values are calculated.

The system reads the logic and converts it into a usable indicator.

Where It Can Be Used

Once created, Xpress Indicators can be used across:

  • Scans
  • Widgets
  • Charts

Ways to Create an Indicator

There are three supported input methods. Each method follows the same workflow and produces the same output.

  1. Copy and paste code or formulas
    Example: Pasting an existing indicator script or mathematical formula
  2. Upload a pre-written script file
    Example: Uploading a saved indicator file
  3. Paste an article or website link
    Example: Providing a link that explains the indicator logic in detail

Getting Started with Xpress Indicator Creation


Step 1: Open the Indicator Dashboard

  1. Visit: https://chartink.com/indicator_dashboard
  2. Click Create a New Indicator

Step 2: Select Indicator Type

After clicking Create a New Indicator, you will see two options:

  • Base Indicators
  • Xpress Indicators

Select Xpress to continue, as this option supports complex formulas.


Method 1: Copy and Paste Indicator Logic

Find the formula for the indicator you want to create.

Example: Search online for the formula of Wilder’s Moving Average and copy the formula.

Make sure the logic clearly represents how the indicator is calculated.


Method 2: Upload a Pre-Written Script File

This method is useful when the indicator logic is already saved as a script file.

Example: A saved indicator script file exported from another platform or editor.


Method 3: Paste an Article or Website Link

This method is useful when the indicator logic is explained in an article or on a website rather than as code or formulas.

Example format:
Review the indicator logic here and create the required indicator:
<article or website link>

Processing and Validation

After submission, Xpress processes the indicator. This usually takes 5–10 minutes, depending on the logic complexity. During this time, the indicator appears under Converting.

Once completed:

  • The status changes to Completed
  • The indicator becomes available for use

Before using it, validate the output:

  • Check recent candle values(Based on Daily timeframe values only)
  • Compare results with the original reference chart or script

Using Xpress Indicator Correctly (Important Guidelines)

While Xpress makes it easier to convert complex logic into indicators, it is important to use it for the right purpose. Incorrect usage can lead to confusing results, unnecessary computation, or indicators that do not behave as intended.

What Not to Use Xpress For(Not a Scan Rule Builder)

Avoid using Xpress to define logic such as:

  • Close above or below a moving average
  • RSI, volume, or price crossing a level
  • Fixed threshold checks (price, volume, market cap, etc.)
  • Simple yes/no scan conditions

These conditions are already supported efficiently inside Scans and should be added there directly.


What Xpress Indicator Is Meant For

Xpress should be used when your idea requires calculation that cannot be expressed as a simple scan filter.

Typical use cases include:

  • Loop-based logic
    • Counting consecutive candles
    • “N out of M” conditions
    • Rolling window calculations
  • Custom indicator construction
    • Indicators built from raw price data
    • Scoring or ranking systems
    • Custom smoothing or aggregation logic
  • State-based logic
    • Trailing stop calculations
    • Trend or regime identification
    • Conditions that depend on previous states
  • Math-heavy transformations
    • Z-scores
    • Correlation or regression
    • Composite or normalized indicators

In short, if your logic needs memory, iteration, or math, Xpress is the right tool.

Good vs Not ideal examples

  • Not ideal: Close > EMA(20) and RSI > 60 :x: 
  • Good: Create an RSI function from scratch by looping gains/losses; output RSI + ‘RSI rising’ flag :white_check_mark:
  • Good: Loop over last 20 candles to compute a momentum score; return score :white_check_mark:

Atlas Dashboard – Grouping Functions

Information regarding how one can use the grouping functions within the Atlas dashboards.

The Group functions enable traders to analyze stock movements by organizing data based on specific conditions for a group like Nifty 50 or Nifty 500 stocks. This makes it easy to quickly extract valuable insights, such as counts, highs, lows, averages, and totals.

For the above explanation, we have created an example dashboard showcasing the Group Function.

Please note, it is necessary to remove the “Grouping” from Group/Sort menu for using the grouping conditions mentioned above.

Remove Grouping

Easily access fundamental stock data with just one click.

The Atlas dashboard shows the stock’s fundamental highlights and financial particulars. Below is the dashboard and a video explaining how to use it. Kindly review.

Dashboard: https://chartink.com/dashboard/243806

Video: https://www.awesomescreenshot.com/video/27977166?key=1a4c74e5e00acf5fc0b70162841f05b8

Financial trend dashboard

The dashboard shows individual stocks and their quarterly and annual profit history. This video will show users how to navigate the ‘Dashboard for Stock History’.

Dashboard: https://chartink.com/dashboard/231204

Notice, how clicking on the “filter” icon on the stock list on the left, show’s the fianncail trend(net profit values over the last few quarters and year)

Web notification troubleshooting

This page focuses on troubleshooting the issues related to push notifications on your desktop and Android mobile devices.

FOR DESKTOP NOTIFICATIONS

If you are unable to see the demo notification pop-up after visiting the demo-notification link, follow the below steps for troubleshooting the same:

STEP 1: Ensure Notifications are allowed on the Chrome browser:

Ensure notifications are allowed in the settings for your browser by clicking on the “lock” sign next to the URL as shown below and going to “site settings” and ensuring “notifications” and “pop-ups and redirects” are set to “Allow”.


Once this is done, try running the demo notification link again. If you now get a pop-up, you’ve successfully enabled web notifications on your desktop.

Step 2: Ensure Notifications for Chrome are enabled on Windows:
  • Open the system settings
  • Click on Notifications & actions
  • Under “Get notifications from these senders,” select Google Chrome and ensure notifications are enabled.

Once enabled, you can run the demo notification again; you should now get a pop-up on your desktop. If you still do not receive a pop-up, kindly contact our support team here for further support – [email protected].

FOR MOBILE (Android) NOTIFICATIONS:

If you are unable to see the demo notification pop-up after visiting the demo-notification link, follow the below steps for troubleshooting the same:

Step 1: Ensure Notifications are allowed on the Chrome browser:

Follow the below video tutorial to enable web push notifications on mobile. Please note web push notifications on mobile are supported only by Andriod devices.

Once this is done, try running the demo notification link again. If you now get a pop-up, you’ve successfully enabled web notifications on your android device.

Step 2: Ensure Notifications for Chrome are allowed via the phone’s app settings:
  • Open your phone’s Settings app
  • Tap Notifications
  • Go to  App settings/App management
  • Locate the app “Google Chrome.”
  • Tap the app
  • Ensure notifications for this app are “Allowed.”


Once this is done, try running the demo notification link again. You should now get a pop-up on your mobile device.

If you still need any help, kindly contact us at [email protected]

Measure – Groupcount

Groupcount helps us to get the count of stocks/entries present for a given group with an optional filter. The “grouping” can be selected via the “group/sort” tabs in a widget, as seen below.

Selecting no group from the above-listed groups would run the widget scan assuming a single group for all the *group* functions.

Examples

  1. Get the count(after an optional filter) of items grouped by a given sector or industry; the below dashboard lists the total number of stocks, number of positive stocks & number of negative stocks, https://chartink.com/dashboard/122841.
  2. Using the count to calculate the % of stocks that have closed positive vs. negative. https://chartink.com/dashboard/122841

Trade/Order book fields unavaliablity for 27-28th Sep’2021

Exchange is conducting an maintenance activity that would impact impact the avaliablitliy of these fields for 2 days, i.e 27th and 28th Sep’21. We’ll be restoring this missing data as soon as we get a update from exchange.

In the meantime, please disable the filters of “Trade & Order book” fields in your scans and widgets, to ensure that this doesn’t impact your scans & alerts due to non avaliablity for these 2 days, below is the list of fields impacted by this activity:

 Buyer initiated trades
 Buyer initiated trades quantity
 Buyer initiated trades average quantity
 Seller initiated trades
 Seller initiated trades quantity
 Seller initiated trades average quantit
 Buyer vs Seller initiated trades ratio
 Buyer vs Seller initiated trades quantity ratio
 Buyer initiated trades VWAP
 Seller initiated trades VWAP
 Total Orders
 Orders Quantity
 Buy Orders
 Buy Orders Quantity
 Sell Orders
 Sell Orders Quantity
 Buy vs Sell orders ratio
 Buy vs Sell orders quantity ratio
 Cancelled Buy Orders
 Cancelled Buy Orders Quantity
 Cancelled Sell Orders
 Cancelled Sell Orders Quantity
 Total Cancelled orders
 Total Cancelled orders quantity
 Cancelled orders ratio
 Cancelled orders quantity ratio
 Buy Orders Vwap
 Sell Orders Vwap
 Orders Vwap

Note: Candlestick data(open,high,low,close..) & other technical indicators(RSI, MACD.. etc) would NOT be impacted by this.

Updates

29th Sep’21 9:20am: The issue is still not resolved, we have notified the exchange regarding the same

29th Sep’21 10:20am: The issue now resolved & these fields are now avaliable, the exhange is working on providing us with the missing data


Trade and Order book fields outage from NSE – Resolved

We are facing issues for trade & order book fields from the exchange starting 31st Aug’21, the exchange has been notified and they are working to fix it.

9:35am – NSE has acknolwdged the issue impacting other clients as well

9:38am – NSE has notified a issue with the AWS feed connecting the exchange

11:37am – NSE has resolved the issue, we’ll be working with shortly to get the missing data

We’ll post further updates on this page

Backtest results FAQ

Backtest results will update or repaint thru the day while the current candle is being built up. Below are the scenarios that should be considered while validating results from the backtested history.

Example 1 (Single timeframe – Daily candles)

A scan running on a daily candle, shown at 10 am, will differ from the results displayed at 12 pm. This is similar to how the indicators/candle would look for the current day on a candlestick chart, i.e., it will continue to change for the day until the market is closed.

Example 2 (Multiple timeframes – 5 minute and Daily candle)

For a scan using 2 different timeframes, i.e 5 minutes and daily candle, the backtest history would show a bar for every 5 minutes(lowest timeframe in the scan), the backtest history would spread the daily candle for every 5 minutes, i.e., the values current spanshot of the daily candles is spread across all 5-minute bars in a day causing the results to change as the current version/snapshot of the daily candle updates.

Unlike Alerts, Backtest is generated on the fly(i.e., the time you view the scan). E.g., If you view the backtested history on such a scan at 12 pm and then re-check it at 3 pm, the backtest bars since market opening, i.e., 9:15 am, 9:20 am, and so on.. may show changed/updated results as the run on 3 pm saw a newer version of the daily candle, as of 3 pm. In such a case, to validate the actual stocks present in a scan at 9:30 am, would be to create an alert and validate the results of the alert’s history instead. As alerts run on the trading time (9:20 am, 9:25 am, 9:30 am), unlike backtest, generated on the fly, i.e., when you view/open the scan page.

Note: This behavior is NOT a bug, but rather how candlestick charts are shown/displayed, the candlestick chart show’s only the current version of the candle and not how it looked every second/minute in a day, which would mean the current candle on a candlestick chart would continue to change/update thru the day while the candle is incomplete

For Fundamental & Technical data, please note, backtest results are not based on historical values (Example: The value of Nifty’s Close was around 20,500 in 2023 vs Nifty’s Close as of today), but based on the current values as of today.