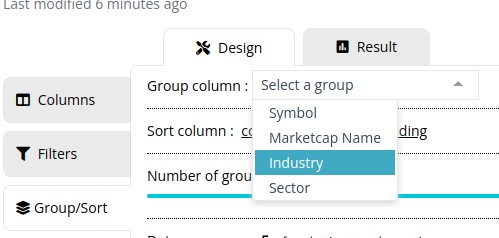
Groupcount helps us to get the count of stocks/entries present for a given group with an optional filter. The “grouping” can be selected via the “group/sort” tabs in a widget, as seen below.
Selecting no group from the above-listed groups would run the widget scan assuming a single group for all the *group* functions.
Examples
- Get the count(after an optional filter) of items grouped by a given sector or industry; the below dashboard lists the total number of stocks, number of positive stocks & number of negative stocks, https://chartink.com/dashboard/122841.
- Using the count to calculate the % of stocks that have closed positive vs. negative. https://chartink.com/dashboard/122841
How to code for narrow spread and wide spread bar
Latest ( Close – Open ) greater than – 1 Day ( Close – Open )
Could you please confirm if you are referring to the size of a candle or the range of band or Pivot levels (to be narrow/wide)?
inadvertantly I tried to change RSI default setting from 14… since then In ‘ charts’ setting is always going to ‘2days’ and ‘5min’ …. How to to go back to defauit settings. Please guide.
How to add the total number of stocks qualified based on the filter in atlas widget.
If this is not possible, how to add column index so that we can scroll down to see the total number of stocks.
Hello Shashi,
I have created an example dashboard; kindly review it –
https://chartink.com/dashboard/150427
In the above dashboard, I have added a condition that shows the number of stocks that are fulfilling the condition added to the count function(crossover in supertrends). I hope this helps.
Thank you for the response. I know this part, using group count. I use it to plot graphs as well.
However, my question was about a widget that lists stocks. In the dashboard, I can use the sector or any other criteria as filter to filter stocks in other widgets. While doing so, I would like to know how many stocks qualified. Since there is no index column as well, I cant see the count.
Ex.
# Sym chg
1. AWL 5%
2. ITC 4%
3. BEL 7%
It would be best if we can display the count, 3, in the header
Hello Shashi – were you able to figure this out?
The count of stocks like… 1,2,3,4 based on the criteria?
Hello,
We can create the same using the dashboard. Please let us know your exact requirements. We will be more than happy to create the same, if possible.
How to add moving average, high, low etc to line graph widget.
For ex, I have a widget to show how many stocks are above 20DMA, I would like to add lines that show –
1. moving average of this
2. high of the values (Resistance)
3. low of values (Support)
4. other reference support\resistance levels.
Hello Shashi,
Below I have created an example dashboard for your reference –
https://chartink.com/dashboard/150429
In the above dashboard, I have added an SMA high20 and SMA low20 with pivot R1 and S1 on a monthly timeframe as support and resistance for it. I hope this helps.
Thank you for the response.
My question was different. I understand that we can plot SMA of a standard attribute.
In your example dashboard, can you had 20SMA for the pivot value R1 and S1? Not the close or high or low of the price.
In my dashboard, I have a line graph drawn using groupcount of stocks above 20SMA to plot market breadth. I want to plot SMA for this groupcount value. I tried creating a custom indicator for the group count and tried to use it in the SMA function; the widget stops working.
Cust_ind = groupcount( {cash} 1 where close > sma( close , 20 ) )
I want to plot SMA (Cust_Ind, 20)
or
SMA (groupcount( {cash} 1 where close > sma( close , 20 ) ), 20)
Hello Shashi, Thank you for clarification; please find the response below –
1 ] I have modified your dashboard, Kindly review – https://chartink.com/dashboard/150429
2] It would not be possible to get the count average. However, We’ve taken this as a feature request and shall plan the possibility of having this added in the near term.
Hello Sir,
Please refer to the second table/block in the dashboard : https://chartink.com/dashboard/116455
I want to create a line chart of the ‘count of stocks that are up more than 3% AND they were down (% change negative) for a period of prior 4 days’ . I tried using CountStreak but I am not sure if it works and I have no way to find out if it is working. Can you correct and help?
Hello,
Do you mean today’s close is greater than the previous close by 3% and from the last 4 days close less than its previous close?
If so, you need to add the below filter in your scan for the last four days down.
1 day ago count( 4, 1 where latest close < 1 day ago close ) = 4
Hello Sir,
I wanted to know that can you provide Smoothed Moving Average indicator in indicators list or if possible can you guide me to create it as a custom indicator ?
Hello,
We currently do not have this available within the system. We will surely keep you posted as and when we have this available. I appreciate your patience.
Is it possible add groupcount as a filter criteria in screener query? Like if advances more then we can show the stocks which meets buy condition?
Hello,
Currently, that would not be possible to do. The groupcount function can only be used in the atlas dashboard as a column.
SIR IF POSSIBLE PLEASE PROVIDE KNOWLEDGE ON ALL YOUR MATH FUNTION
Hello Santanu, Below I have added some explanation on usage of few Math functions –
Min – Returns the minimum value from a specific duration. For example, for finding the minimum volume in the last 10 candles, we would use “Latest Min ( 10 , Latest Volume ) “
Example – https://chartink.com/screener/latest-close-is-less-than-the-minimum-close-in-the-last-10-days
Max – Retrieves the maximum value of a given attribute (open, high etc..) throughout “n” candles/periods. It can even work on like addition, subtraction and so on.. e.g. “max(20, high + low + close / 3)
Example – The Current volume is the maximum volume in the previous 50 days volumes.
Count –
Returns the count of candles that have met a given filter. To have multiple filters, we can nest or combine 2 or more counts, eg “count( count() + count() equals 2 ) equals 1”
Example – https://chartink.com/screener/close-greater-than-open-greater-than-equal-to-6-in-last-10-days-with-count
Greatest – Fetches the highest value from a different set of values. For example, if you want the greatest value out of 3 different SMA’s (20, 50, & 100), you can use the greatest function to get this value.
Example – https://chartink.com/screener/sma-200-greater-than-all-3-sma-s-20-50-100-daily-timeframe
The new charts are good.
1) a watchlist on right side pan is required with results from scans, which can be scrolled with keyboard arrow up/dn for charts on left pan.
2) a template button which can be saved for view/preferences/indicators etc.
3) a weekly plan for people who are on the fence to join or test the feature to commit for yearly monthly plan.
And yes pls get a broker license so that people can automate based on your strategies.
Great Job Chartink Team
I second this.
1. Add a feature that shows watchlists on the right side of charts. in addition, user should be able to add their scans as watchlists on the chart screen itself (sort of like a scan widget on the chart page). makes it easier to view charts of stocks on the watchlist which is built from a scan.
Hello,
Thank you for the valuable suggestion and the feedback.
how to use chartink for nifty index option trading.
please provide help line number
Hello,
We currently support only NSE cash stocks and indices; we have created a segment group named ‘futures’ to scan stocks traded in the F&O group. If you select futures, scanning will be done based on cash stock prices/ values. Hello, We currently support only NSE cash stocks and indices; we plan to add Global stocks and indices too shortly.
In my chartlink dashboard more than 13 screener i want to know stock are unique
Hello,
Here, we assume you wish to know which are the common stocks in all 13 widgets of your dashboard. If yes, then please click on the ‘funnel’ icon that is in front of the stocks symbol.
I have groupcount logic as one column. I want to add 2nd column with nifty price data to be plotted in Y-axis. Is it possible to do it ?
Greetings! At this moment, we do not offer the feature to run the same widget on a group as well as individual stocks/indices, as you mentioned. Nonetheless, we are actively exploring the option of adding it along with new indicators.
I am unable to provide a specific timeline for the addition of this feature, but I have forwarded your request to our Development team for future consideration.
We value your patience and look forward to enhancing our service for our valuable users.