We’ve added the ability to access any candle of the latest trading day or previous days for Intraday timeframes. Useful for scans that require to access indicator values at a given point in time.
Example offset’s to access different candles for a trading day (5 minute chart)
- [0] 5 minute close -> refers to the latest 5 minute candle
- [=1] 5 minute close -> refers to the days’ first 5 minute candle
- [=3] 5 minute close -> refers to the days’ third 5 minute candle
- [=-1] 5 minute close -> refers to the previous day’s last 5 minute candle
- [=-75] 5 minute close -> refers to the previous day’s first 5 minute candle, considering a single day has 75, 5 minute candles
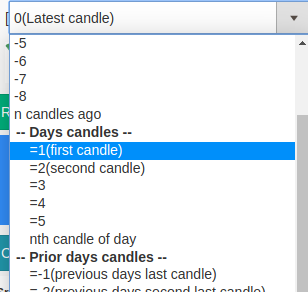
If you want to access the first candle on a 5 minute timeframe(9:15-9:19:59am), you can select your required indicator/stock attribute and then change the offset to `=1` as indicated below:
Crossover Support
Days candles also support crossover/below operations. For example, to identify a crossover at the opening candle, we can do “[0] 5 minute Close Crossed above [=1] 5 minute SuperTrend(7,3)”
Example scans
- 3 White soliders – 15 minute
- Open range breakout – 5 minute
- Market opening supertrend crossover – 5 minute
Thank u very much again salute….
Thank you for your feedback
( {57960} ( [0] 15 minute close > [-1] 15 minute max ( 20 , [0] 15 minute close ) and [0] 15 minute volume > [0] 15 minute sma ( volume,20 ) ) )
in this 15min breakout why are using present candle in max function and previous candle before that
thank you
It checks if current candles close is greater than maxmium of previous 20 candles and if volume is greater than average of previous 20 candles volume.
Still not clear. Can u explain full syntax used in the line
Great Great Great
Very Useful Feature.
HELLO I M YAGNESH CAN YOU PLEASE KNOW ME WHAT IS TO WRITE IN AFL FOR THAT.
This is very good. Please also add functionality to select a range like if I want if any condition happened during whole day so I can give day’s first bar to last bar in the scan.
Sure, we’ll add this soon
I can not see candles to select … Where I can find it
Mr. Akash,
Would you please tell how to scan the criteria like below:
“When closing value of candle goes below the crossing value of either previous 2 or 3 or 4 or candle but simultaneously RSI(14) value goes above the value of that specific candle”
For example, in 30 min time frame 4th candle of the day closes below the value of 1st candle stick close value. Simultaneously RSI value of 4th candle would be more than that of 1st candle RSI value.
It is just detection of divergence in RSI for any time frames. Please let me know how to scan such criteria please
UNABLE TO UNDERSTAND
We’ve added examples, that would help to understand
Please give the link of examples
chakkass,,,,,very very use full. earlier i have to change the candle number as pass the every candle of time ..thank uuuuuuu
Great. Keep it up. I need stochastic momentum index indicator. Till now I didn’t earn profit for last 4 months. If you add stochastic momentum index, I will be grateful to Chartink. Tku
Hi Team,
Can you please add Gann number option in scanner.
Secondly you can ask how many upside and downside Gann level should be on chart.
Thanks
woo.
i am waiting for this feature for long.
Good works folks .
It’s different. Let’s try it.
This feature is amazing Chartink team. You have out done yourself this time.
Glad to be user of this amazing tool.
sir,
i excess your chart daily the additional feature are you giving free or chargeable your charting system is good & do inform about more indicator for educational purpose if you can display nifty put call chart it will be great. thank you
mahesh.
Not able to understand this feature correctly, kindly give this with an example of a scanner scrip please.
Please can update any examples videos…. Thanks
Hello,
Could you please update chart on Renko in the chart sections.
Nice i like it
Its ok
sir i have no idea in technical setting so please give me link through email.
Its something new in the scanner
working on chart since 1985
ThIs application is really awesome.thank you for your valuable support.
Now add oi please
what a great work. amazing that my requirement was seriously considered and implemented in no time. iam very thankful for your wonderful service
regards,
sathya
Please add to the weekly and monthly timeframe as well.
Thanks sir.. doing great support to traders.
Hi,
Is it possible to code 1/2/3..n day ago 1/2/3/..nth (15min)candle so that i could easily back test my strategies??
good work sir , i m new here plz can u share any link how to use sub filter and other function i m unable to use it and plz add one more important feature in chart wneh we work on chart with drawing but when we open next time it removes all drawing not show r support and resistance make chart easy like amibroker charting plz sir thanks
and plz give link how we can baktest on this
Hi Akash can you please add first candle option for previous days also since now available for only latest day. Thanks…
Hello, Chartink system is class apart. If you could include subscription based backtesting feature then we could test our strategies also.
sir how can i refer a candle before today’s 1st candle, your days 1st candle has improves stock screening for intraday very much for me,
Hi,
Chartink is one of the best charting available now.
Can you please explore the possibility of chart movement for any time frame with the help of mouse (like tradingview.com)
Thanks and Regards,
Rangaswamy
Hi there,
Can we apply this functionality on historical data i.e. first candle of previous 2 days?
When I was playing around this, I saw that it’s possible but when I tried next time, it’s not allowing me.
Any updates on this are highly appreciated!
Thank you!
Best regards,
Abhijeet
Sir
can we change the color for Heikinishi candle pattern? if so how? pl advise
its a wonderful !!!!
Great !
PLease add a feature to add stocks to watchlist directly from scan results
Hi i want to create an alert when the 16th 1 min candle crosses above the high of the 1st 15 min candle. I tried for many 1 min candles ( from 16 to 31). but the query is not throwing up any stocks. Could you please advise.
Many thanks
Suresh
All the best..you will reach many heights.god bless you
Great work Shekhar,
Salute you.
Please add Stokastic Momentum Index (SMI)
thank u akash,
it’s a great help we were eagerly waiting for this and finally you people have done it.
me analyst h.aving. 66% accuracy ….i regularly your charts since few years it works. well unders.table g.ives. clear picture of mkt plz update me on 9819140743 or 9819134791 g.ood wis.h.es.
price volume index scanner please
Akash ji,
Please add Quarterly & Yearly chart in chartink website, it will help to investors.
No update bse & x, xt group stocks in scan.
Thank you
Hello,
Charts are updated every 1 minute only for NSE stocks. We do plan on adding BSE later. One can view charts of 3, 6, 9 and more months by choosing the same from the dropdown menu.
Mr.Aakash,
When we get F&O quotes?
Please add OI , IV
and PCR
Hello,
We do plan on adding F&O calls in the near term. Shall keep you posted.
i will take subscription shortly. Also plz add trendline alert ASAP
Hello,
Which trendline alert you need? We can use min/ max functions to find normal trendlines
Are planning to add feature to customize the columns of exported report. For e.g i want to add previous day close in my exported report.
Hello,
Currently we do not have this feature. we do plan on adding it in the near term.
I have been hearing this from long time. Do you have any timeframe for this feature.
No, currently not really possible to give an ETA on the same.
I need to understand chart for making trades as I trade online and take position and losing huge money please help me my number is 9810935042 please call me or give your mobile number at my email id [email protected] I will call you
Sorry to hear about your loss. We provide only email support, please feel free to share you doubts at [email protected]. You can start by reviewing out top scans here: https://chartink.com/screeners/top-loved-screeners
They contain the top 10 scans used for Intraday/Swing & short term trading
FILTER STOCK IN IST CANDLE OF 15MINUTES
Yes, these scans as possible. We provide dedicated scanner support only to our premium members which allows you send your scan requirements and we create and share the scan with you.
You can start by reviewing out top scans here: https://chartink.com/screeners/top-loved-screeners
They contain the top 10 scans used for Intraday/Swing & short term trading
Hi Team,
I can see the back test result of scan generated stock time
Mon Mar 25 2019 00:00:00 GMT+0530 (India Standard Time)
i would like to know what would be the right IST time for this time entry.
Regards
Rajkumar.S
For daily candles i.e with time :00, the time doesn’t matter, it indicates list of stocks for a given date.
Sir I am facing difficulties in coding days 1st 5 mins candle breakout as following:
Range of today’s 1st 5 mins candle is greater than last 5 Days 1st 5 mins candle. Could you please guide me
Yes, these scans as possible. We provide dedicated scanner support only to our premium members which allows you send your scan requirements and we create and share the scan with you. Please email at [email protected]
I am a premium customer. I have some queries.
1. Suppose i have a scanner which is returning 2 stocks for 10th April based on first and second 5 minute candles of a day but when i see backtest results , it shows those 2 stocks @3:25 PM time and some other stocks @different time in a day.
So my question is if my scanner is based on first and second candles why does it show other stocks in backtest results.Please explain. I think backtest is not working properly.
2.Can you create dedicated scanner for me which filters stocks based on any 5 min candle not any specific time candle means i will not provide any specific no candle like first , second .
Hope this helps on back-testing:
https://chartink.com/articles/?s=back
It will show the previous days/ minutes results for your scan without the need for you to modify the scan. Back-testing will not give alerts. It is only to analyze/ view stocks previously triggered by your scans. If you click on any of the bars on the graph, it will show the list of stocks that triggered as per the scan previously.
Back-test data will show data for the lowest candle time frame in your scan. If lowest time frame is 1 minute, it will show results for last 1 minutes. If its on daily candle it will show data for past 6 months. We show results for the past 150 bars in our backtest section, these 150 candles could be of any timeframe, depending on the lowest timeframe in your scan, so for 5 minutes for example, you would get 2 days, for 1 minute, half a day and so on.
Please share your scan requirements on [email protected] and we shall create the scan for you.
Hi:
Can you pl clarify – during mkt hrs – latest close means – whether it denotes previous days close or the price at that minute when scan is done?
Secondly, during holiday – say Sunday – latest close means – friday close and one day ago means thursday close – right?
Hello,
It refers to the today’s updated candle. Yes, during weekends it refers to Friday and one day ago close to Thursday.
Hello ,
After creating a scanner using the above filter( daily 1st , 2nd candle, etc) backtesting result will not be accurate.
For Example,
If i want to scan stocks which breaks high of 1st candle(Hourly). then backtest data will not show the statistics of previous days correct report.
Hope this helps on back-testing:
https://chartink.com/articles/?s=back
It will show the previous days/ minutes results for your scan without the need for you to modify the scan. Back-testing will not give alerts. It is only to analyze/ view stocks previously triggered by your scans. If you click on any of the bars on the graph, it will show the list of stocks that triggered as per the scan previously.
Back-test data will show data for the lowest candle time frame in your scan. If lowest time frame is 1 minute, it will show results for last 1 minutes. If its on daily candle it will show data for past 6 months. We show results for the past 150 bars in our backtest section, these 150 candles could be of any timeframe, depending on the lowest timeframe in your scan, so for 5 minutes for example, you would get 2 days, for 1 minute, half a day and so on.
If you have the alert frequency of 5 minutes on a 1 hour candle scan, the alert results will update every 5 minutes and so will the backtest results(if you open the site and view the graph every 5 minutes), the difference is that the alert keeps a history of all your stocks triggered every 5 minutes i.e at 9:20am, 9:25am and so on via the alert history page,, whereas the backtest graph doesn’t keep any history as such, it will show the results only as of the candle completion time i.e 10:15am. so its not necessary that the backtest will show all the stocks that were triggered every 5 minutes as your alert show’s.
Alerts is a premium feature that would allow you to do this, it keeps a track of all your stocks that met the condition every 5 minutes so that you don’t need to keep a track of them manually in the scanner page or the backtesting graph. The backtest is a dynamic graph that would update/change as your 1 hour candle is changing.
How to get formula in chart ink any body can help me.
open first 30 min. close. than 2nd or any candle 30 min. candle open with high than 1st Candle (Each Candle Time frame is 30mins Intra-day )
RSI should be more than 40 or below 40
Hello,
Are you looking for current candles high greater than days first 30 min candle high? Below is a scan for the same:
https://chartink.com/screener/current-1-min-high-greater-than-days-first-30-min-high-1
Hi Team ,
I wants to get results of backtest data with volume label and %change
Hello,
Currently, we do not have this feature. However, we may plan on adding it in the near term & l shall keep you posted on this.
I am looking for Chartink scanner with the following conditions for Opening Range Breakout:- Can somebody help?
The scanner should start from 9:30 AM(15mins ORB)
The first 15-minute(9:15 candle) candle should be a flat opening, the high and low should be of a low range.
First 15 minute candle should not be more than 1% gain.
The breakout candle(9:30 candle) should not be more than 3% gain
he scanner should not show gap up stocks
9:30 candle should not repaint 9:15 candle/stocks
The scanner should not show low volume stocks
Hello,
We have created the scan. Kindly review.
https://chartink.com/screener/first-15-minute-candle-should-not-be-more-than-1-gain
Note: Your query about the repainting is not very clear. Could you please elaborate more on the same and, if possible, share a sample chart image for reference?
How to filter Stocks whose 5minute ema20 crosses 5minute ema50 from first 5 monte candle to last 5 minute candle. Such that the scanner don’t only scan the latest candle to meet the criteria. Means in a trading session if the criteria meets at any latest or previous candle of any stock.
Hi, How to find if any of the candles in the last few sessions was green and to combine it with another condition if the 1st condition is passed
For example, i want to find out – in the Weekly chart, was there any weekly volume candle in the last 12 weeks which was green and also above the SMA 21 of Weekly volume candles.
Can you please help?
Hello,
Sure, you can use the nested count function to achieve this. Here is a scan for the same:
https://chartink.com/screener/green-volume-above-sma-21-in-any-1-of-the-last-12-weeks-weekly-timeframe
I hope this helps.