The backtesting feature enables you to validate your stock against historical data, ultimately improving the accuracy used in the scan.
How to verify the stocks in the backtest?
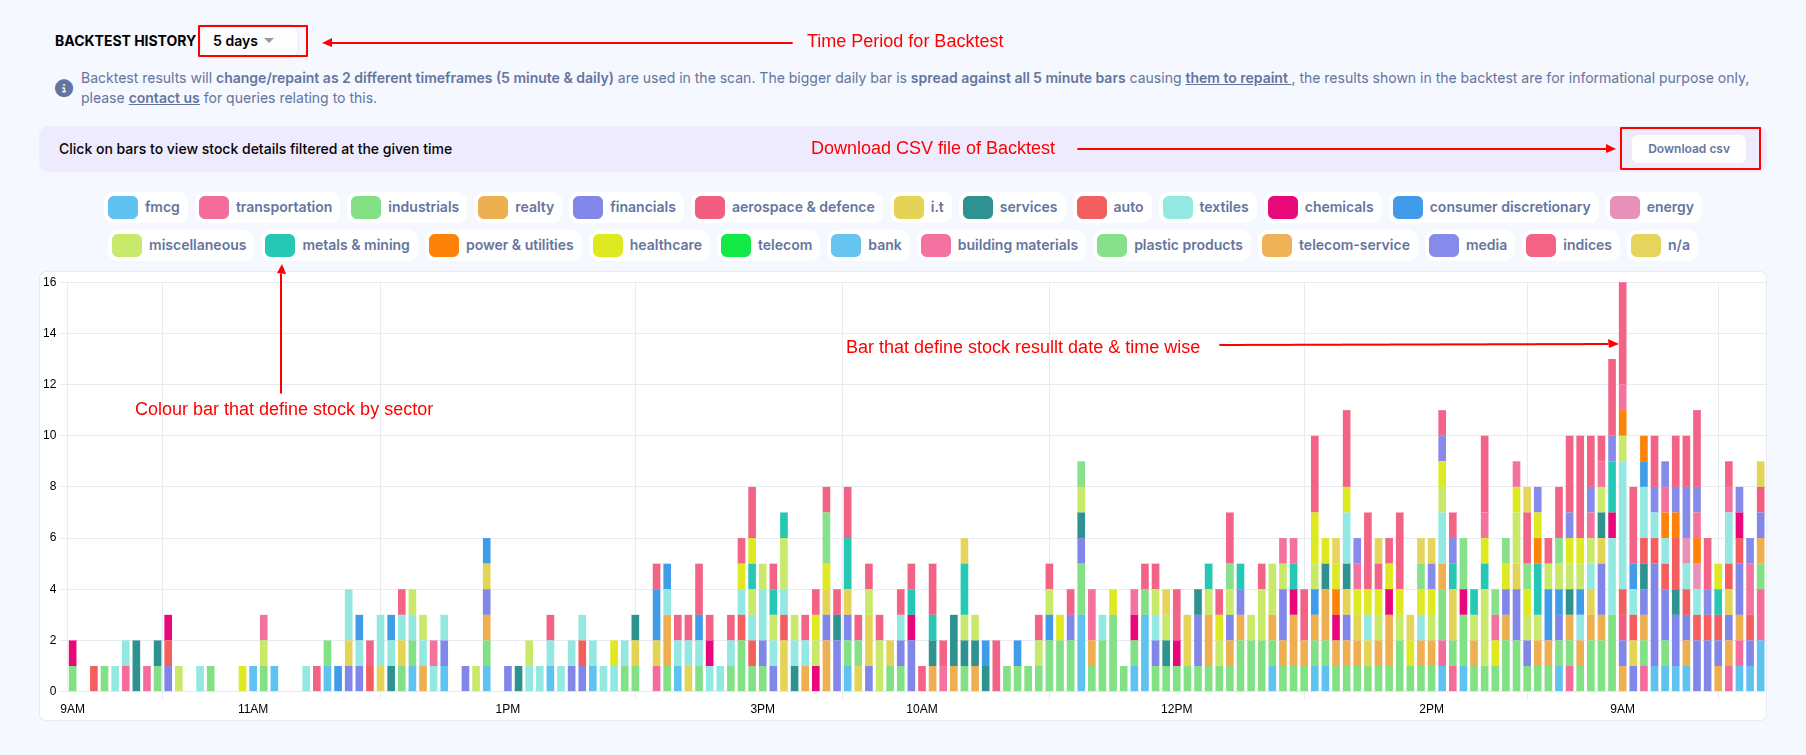
- We offer a “Backtest Results” option for all scans, which is located below the scan conditions (pink button).
- This feature enables you to view the backtest bars, where you can select a specific date and time to see how many stocks fulfilled the scan conditions at that point in time.
- Upon clicking on the bars, you can access the stock names (SYMBOLS) and click on them to redirect to the charts.
- Here I have attached an image below & a video tutorial on this for reference – Verify backtest
What is the backtest history limit for different timeframes for scans?
The backtest bars are always based on the smallest time frame you choose in the scan. Below, I’ve included a list of scan timeframes with the corresponding maximum backtest period –
- 5 minutes – 3 Weeks
- 15 minutes – 4 months
- 30 minutes – 8 months
- 1 hour – 1 year & 4 months
- Daily – 9 years.
Note – Backtest is limited to the first option only from the dropdown(Backtest history limit).

Do Backtest results keep updating/repainting?
Assuming the scan is made of different types of timeframe conditions, shown below –
- 5-minute close greater than the previous 5-minute close
- The latest RSI is greater than 70. For example, RSI greater than 70.
In this type of condition, you may ignore the backtest results as they may not always be accurate due to multiple time frame candles used in the scan(5-minute and daily candles). Backtest results use a higher timeframe(daily) candle that would spread for all bars within the backtest history. As long as the higher timeframe candle is incomplete, all bars in the backtest would also change/update, leading to potential inaccuracies.
In contrast, the alerts you receive for this scan are accurate and sent instantly once any stock matches all scan criteria.
Why do the Volume conditions affect my backtest results?
When using volume as a condition in the scans, it’s possible that some stocks may not immediately appear in the results when verifying with backtests. This is because the volume condition takes time to fulfil.
For example, if we have a scan with two conditions, such as a “15-minute RSI crossed above 60 and daily volume above 1 Lakh“, let’s say the ABC stock fulfils the RSI condition at 9:30 AM, but the volume condition is not yet met at that time. Due to this, the stock ABC will not show in the backtest.
However, if ABC meets all conditions later in the day (e.g., at 11 AM), the backtest will reflect the ABC stock in the backtest at 9:30 AM. So, if you want to avoid this behaviour, you can disable the volume condition.
Backtest results timing not matching alerts?
I assume you were comparing the backtest result time with the alert time. Note that the backtest will show the candle start time, whereas the alert you received is on the completed candle when a stock matches all the criteria.
To explain it in more detail, if you have a scanner for a condition such as “1-hour RSI greater than 60” and received an alert at 09:45 AM (assuming an alert time interval of 5 minutes), the backtest result will show 09:15 AM, which starts the time of the 1-hour candle. Hence, the backtest always shows the start time of that candle, whereas the alert you received is on the completed candle.
How to match backtest results with alert timing?
To ensure that the backtest results match the scan results, we recommend using the same time frame candles in the scan. For example – MACD Line crossing to MACD Signal in 15 minutes
Note, If you are using a 15-minute timeframe in your scan, then you should set your alert time interval to 15 minutes as well. This will ensure that you receive alerts based on completed 15-minute candles that satisfy the scan criteria.
Stocks showing in the backtest, but did not get an alert for it?
Assuming the scan has different time frames like “Daily, Weekly and Monthly”, for example, NKS BEST BUY STOCKS FOR INTRADAY
The reason for the discrepancy in the backtest results is that the scan is using the weekly and monthly timeframes, and when we are running the scan between the week/month. As a result, the scan is showing results based on an incomplete weekly/monthly candle. This causes the results in the backtest to continue to repaint/updated until the weekly and monthly candle completes its formation.
How do I view the profitability of the scan in the back test results?
Even Im wondering.. The history of alerts is already available under alerts. Its the same information shown in backtesting. nothing new..
The backtest history currently show’s the number of stocks filtered per timeframe(day, minute, week..) grouped by its market cap. If you have a scan on which there’s no alert setup, you can view its history too, here.
This gives you a instant view of how stocks trended within a particular scan without the need to manually change offset’s within the scan
the scans are done only on 1 day candle time frame? can it be done on 15min 30 min candle time frame?
Sure, you need to click on “latest” and change the time frame. Below is an example scan for 15 minute time frame. you may click on “15 minute” candle to modify the time frame and save the same later.
https://chartink.com/screener/stock-crosses-below-pivot-point-support-2-15-min
Hi
I m just watching scanner since 2-3 month . I found interesting but have some difficulties & suggestion as follow.
1) back test info is in bar chart form and show sector which is difficult to remember ( symbols , date time ,rate etc ) for comparison purpose. Request if possible , can u provide scan data in tabulation form which can also convert in xl etc ,
2) can u give additional filters on index like, pass all if nifty grater then EMA xx
, Pass all if weekly bank nifty ……. , Because 80% cash , future moves as per index..
3) can we use if …. Then…else,
Not.,
4) in future segment , is index futures included in future data?
5) in chart section , can u make button for 5 Mon ,15 min , 30 min, 1 HR, 1 day , if 5 min period 3 days, 30 min period 20 days , dayly period 6-9 month like wise
Which can give speedy view during live market..
If u can provide multiple chart , at least 2 chart of diff time of same symbole, ie one for intraday one for daily .. one in front other in back..
This gives independent s from other charting tools, speed ..
Your platform is user-friendly , but I need some more in atleast backtest data ,which may increase profit and reduce loss..
My no is9374978934 I like to talk to u in matters of possible..
Hello,
Thanks a lot for your suggestions. We shall get with the team on this.
nice suggestions.
dear chartink
the formula for pivot does not calculate correct result as per formula
today’s pivot = today’s(hlc/3)
instead it calculates
today’s pivot = d-1 (hlc/3) or d-2(hlc/3)
today
https://chartink.com/screener/pivot-checkup
should give mindtree (pivot 1744.65) but it gives blank..
Hello,
Pivot points are always calculated on previous days high/ low/ close values and not current days. If you are looking for tomorrows pivot levels, then one may use current days values.
Not able to understand this back testing. It shows number of stocks in the backtesting. But what about the results of backtesting if I chose one stock to see the details of buy and sell.
Click on the individual bars to view the list of stocks filtered on a particular day. We’ll soon have a search bar to search for individual stock’s buy/sell entries
It helps! Thanks a lot
Is this functionality available now?
Not yet. We do plan on adding it in the near term. Shall keep you posted.
how short?
Has this feature been added?
Thanks Alot, it will help us for sure..
is it applied on the alerts we got or how do you decide whether the strategy is successful or failed ? because we didn’t have any exit conditions , please provide the details on how this works and how we can use it ?
No, this does not depend on alerts. You can view the history for any of our 5+ lacs scan instantly
Very nice update! Thanks for adding this unique feature.
Could you please add export results to excel from the backtest?
Thanks. Sure, we do plan on adding it soon.
waiting for long
but still it has to be refined
Yes, we do plan on add more features soon.
Dear Akash,
I urege you to mention sector of filtered list in scan results, this will very useful to all.
Suppose I have created a scan to know how much stocks are trading above RSI 70 in Future segement, than it might show me 100 stocks but if the sector is mentioned along with them than I can also know which particular sector is strong.
I think all are agree with me. Hope to have it soon.
Yes. We do plan on changing it to industry based in coming days.
सर थैंक्स फॉर बैक टेस्ट सर मगर एक काम और कर दो जैसे जो सिग्नल हमारे अलर्टस में आते है उनके आगे जिस टाइम वोः अये है उसका एन्टेरी रेट और करंट डेट में उसका क्या प्राइस है हो मेरा tgrget हुआ की नहीं नहीं
जैसे
DLF – 160 पे आज आया और मेरा tgrget 5 % का है क्या वोः उस भाव से उतना ऊपर गया की नहीं यह और पता लग जाये अगर गया है तोः वोः ग्रीन शो करे और नहीं गया तोः रेड और टोटल कितने सिग्नल sucess रहे और कितने फ़ैल रहे मेरे अलर्टस में प्लीज इसे और डेवलप कर दो और एक पेज अलर्टस का और बनाओ जैसे मैंने 10 अलर्टस लगा रखे है और मुझे सब पे अलग अलग जाके चेक करना पड़ता है
एक मैं अलर्टस बनो उसमें उस दिन के सरे अलर्टस शो करे ताकि अलग अलग अलर्टस पे जाके चेक न करना पड़े बस एक अलर्टस खोला और देखते रहे उसमें
थैंक्स
You have emailed, we shall respond shortly.
This is not Backtesting, very disappointed by this so called Backtesting.
It will show the previous days/ minutes results for your scan without the need for you to modify the scan. Back-testing will not give alerts. It is only to analyze/ view stocks previously triggered by your scans. If you click on any of the bars on the graph, it will show the list of stocks that triggered as per the scan previously.
Back-test data will show data for the lowest candle time frame in your scan. If lowest time frame is 1 minute, it will show results for last 1 minutes. If its on daily candle it will show data for past 6 months. We do plan on adding more features in coming days
sirf ek din ka back test hi dikha raha hai uska kya fayda sir
Back-test data will show data for the lowest candle time frame in your scan. If lowest time frame is 1 minute, it will show results for last 1 minutes. If its on daily candle it will show data for past 6 months.
Intraday scanners backtesting not available ..
Working only on daily candle.
Back-test data will show data for the lowest candle time frame in your scan. If lowest time frame is 1 minute, it will show results for last 1 minutes. If its on daily candle it will show data for past 6 months.
The back test here shows efficacy of a scan .. meaning, how the stock which fitted in the scan performed after that day? Am I right, sir?
Yes. that is correct. It will show the previous days/ minutes results for your scan without the need for you to modify the scan. Back-testing will not give alerts. It is only to analyze/ view stocks previously triggered by your scans. If you click on any of the bars on the graph, it will show the list of stocks that triggered as per the scan previously.
Back-test data will show data for the lowest candle time frame in your scan. If lowest time frame is 1 minute, it will show results for last 1 minutes. If its on daily candle it will show data for past 6 months. We show results for the past 150 bars in our backtest section, these 150 candles could be of any timeframe, depending on the lowest timeframe in your scan, so for 5 minutes for example, you would get 2 days, for 1 minute, half a day and so on.
Bactesting a great feature but 150 candles not enough on intraday frame like 5 mins or less.
Yes, we do plan on adding more features to the same in near term. Shall keep you posted.
Please implement a backtest for 5 minutes timeframes at least of 2 months back. This can be done maybe by selecting a date from a drop down box
We do plan on more improvements in the back-test feature. Shall keep you posted
Looks like backtesing considers ” Passes All” as “Passes Any” when grouping filters
Check it out ….
Are you still facing this issue? please email us at [email protected]
Please make a scanner about RSI positive and negative divergence and plz create a system to talk to our favourite scanner creator…
Thanks
I replied to your comment on the other page.
The history of alerts which is available under alerts is different with information shown in back testing for same scan. Please clarify…
How to get previous day close of future stocks.
Hello,
Currently we do not have the feature to display previous days close for stocks in a scan.
Backtest on a banknifty strategy gives results which are for all indices. Expectation is that backtest of the strategy on a stock or index gives results of that stock or index only.
My bad. I wrongly interpreted the results.
The backtest works really well for me. Great feature to have.
Nice to hear that.
You can backtest it on your watchlist. Watchlist should contain only the stock/index ylu want to analyse with a particular scanner.
The history of alerts which is available under alerts is different with information shown in back testing for same scan. Please clarify…
Hope this helps on back-testing:
https://chartink.com/articles/?s=back
It will show the previous days/ minutes results for your scan without the need for you to modify the scan. Back-testing will not give alerts. It is only to analyze/ view stocks previously triggered by your scans. If you click on any of the bars on the graph, it will show the list of stocks that triggered as per the scan previously.
Back-test data will show data for the lowest candle time frame in your scan. If lowest time frame is 1 minute, it will show results for last 1 minutes. If its on daily candle it will show data for past 6 months. We show results for the past 150 bars in our backtest section, these 150 candles could be of any timeframe, depending on the lowest timeframe in your scan, so for 5 minutes for example, you would get 2 days, for 1 minute, half a day and so on.
Thanks for your reply.
As i mention the result of back test is different with Alert for scan. I know back test not give the alert.
But when i check my scan alert with back-test result is not match.
Today in back test result show M&M FIN for Buy . But when i go and check in scan alert it not show..
Example, If you have the alert frequency of 5 minutes on a 1 hour candle scan, the alert results will update every 5 minutes and so will the backtest results(if you open the site and view the graph every 5 minutes), the difference is that the alert keeps a history of all your stocks triggered every 5 minutes i.e at 9:20am, 9:25am and so on via the alert history page,, whereas the backtest graph doesn’t keep any history as such, it will show the results only as of the candle completion time i.e 10:15am. so its not necessary that the backtest will show all the stocks that were triggered every 5 minutes as your alert show’s.
Alerts is a premium feature that would allow you to do this, it keeps a track of all your stocks that met the condition every 5 minutes so that you don’t need to keep a track of them manually in the scanner page or the backtesting graph. The backtest is a dynamic graph that would update/change as your 1 hour candle is changing.
Hope this clears the confusion that you are facing.
Dear sir,
I think in Charting screener there no data available of Delivery Holding of Previous trading day as available in NSE site, please update this option of Delivery Holding data so that BTST/Intraday Traders can take benefit to make strategy on those stock having good Holding.
Currently we do not have this feature. We may plan on adding it in the near term. Shall keep you posted.
Wrong system. i used weekly scanner to generate alerts. however, live alerts generated by scanner is not included in backtesting. Only those alerts are included in the system where condition is met in order to earn more subscription revenue.
Please note that backtest is a free feature, we have not yet added this a premium member feature so there’s no revenue or earning from the same rather backtesting excessive load to compute the results.
Here’s the response to your query:
Example, If you have the alert frequency of 5 minutes on a 1 hour candle scan, the alert results will update every 5 minutes and so will the backtest results(if you open the site and view the graph every 5 minutes), the difference is that the alert keeps a history of all your stocks triggered every 5 minutes i.e at 9:20am, 9:25am and so on via the alert history page,, whereas the backtest graph doesn’t keep any history as such, it will show the results only as of the candle completion time i.e 10:15am. so its not necessary that the backtest will show all the stocks that were triggered every 5 minutes as your alert show’s.
Alerts is a premium feature that would allow you to do this, it keeps a track of all your stocks that met the condition every 5 minutes so that you don’t need to keep a track of them manually in the scanner page or the backtesting graph. The backtest is a dynamic graph that would update/change as your 1 hour candle is changing.
Hope this clears the confusion that you are facing.
Yes
No contact details are provided in order to get response.
We did reply to your emails too and tried clearing the confusion. Currently we provide only email support, please feel free to share your doubts there.
It is not back testing of scanner, it is absolutely wrong information given for a scanner. It is not showing complete results, and also Stocks that don’t give desired result are removed very smartly from the back-tested results..
Sorry, please note the backtest graph show’s results based on completed candles. If you viewing larger timeframes like weekly or monthly the results of the backtest will change for the latest candle, as the candle is still being built while the week or month is open.
Further, we don’t remove or manually add any stocks, the stocks are displayed as per the indicators used in your scanner which is not within our control
Yes
Please see
I had posted a comment on mis-information given by your back testing graph..that stocks which are not giving desired results are deleted, why you removed the same?
We did reply above. Below is the reply we posted:
Sorry, please note the backtest graph show’s results based on completed candles. If you viewing larger timeframes like weekly or monthly the results of the backtest will change for the latest candle, as the candle is still being built while the week or month is open.
Further, we don’t remove or manually add any stocks, the stocks are displayed as per the indicators used in your scanner which is not within our control
May be correct but set system in a way that once symbol shown , remain forever. It is users headache to correct scanner otherwise user remain misguided and blame u.
Pl think again
Please provide the data for commodity also it will be very help full. I am very eager to and ready to pay for it
Currently we support only NSE cash stocks and indices. We do plan on adding others soon. Shall keep you posted.
Now I am free on ,y pc
I want know about this in detail
if available please try to contact me on m.no.9890714376
or give me your contact details please I will try to contact
Thanks
Please email your queries at [email protected]
As a premium member you would be able to:
Access realtime data for Charts & Scans every minute
Create Alerts and receive updates of stock breakouts over sms/email/mobile/desktop
View charts in 1/2/3 minute timeframes with auto-refresh
Run screeners in 1/2/3 minute timeframes with auto-refresh
Scan any watchlist via the segment dropdown of a scan
Get Dedicated support for your scanner requirements
You can get details/signup our premium service here: https://chartink.com/subscription
Please email us your queries at [email protected]
its backtest update instantly or only EOD? Suppose 10 minute put scanner. So every 10 minute this back test update or Todays all the result updated EOD?
Hope this helps on back-testing:
https://chartink.com/articles/?s=back
It will show the previous days/ minutes results for your scan without the need for you to modify the scan. Back-testing will not give alerts. It is only to analyze/ view stocks previously triggered by your scans. If you click on any of the bars on the graph, it will show the list of stocks that triggered as per the scan previously.
Back-test data will show data for the lowest candle time frame in your scan. If lowest time frame is 1 minute, it will show results for last 1 minutes. If its on daily candle it will show data for past 6 months. We show results for the past 150 bars in our backtest section, these 150 candles could be of any timeframe, depending on the lowest timeframe in your scan, so for 5 minutes for example, you would get 2 days, for 1 minute, half a day and so on.
If you have the alert frequency of 5 minutes on a 1 hour candle scan, the alert results will update every 5 minutes and so will the backtest results(if you open the site and view the graph every 5 minutes), the difference is that the alert keeps a history of all your stocks triggered every 5 minutes i.e at 9:20am, 9:25am and so on via the alert history page,, whereas the backtest graph doesn’t keep any history as such, it will show the results only as of the candle completion time i.e 10:15am. so its not necessary that the backtest will show all the stocks that were triggered every 5 minutes as your alert show’s.
Alerts is a premium feature that would allow you to do this, it keeps a track of all your stocks that met the condition every 5 minutes so that you don’t need to keep a track of them manually in the scanner page or the backtesting graph. The backtest is a dynamic graph that would update/change as your 1 hour candle is changing.
Currently backtesting result shows time for a particular stock meeting criteria as 00:00:00 GMT as shown below:
Fri Jun 21 2019 00:00:00 GMT+0530 (India Standard Time)
Is there any way to know exactly at what time during the day screener filtered the stock? I know that if we create alert we get email/sms exactly at the time stocks are filtered by the screener for today and going ahead.
I am more interested in at what time individual stocks were filtered by the screener during past 7 months of backtesting results as shown by the backtest history tab.
I notice that you are viewing the results on a daily candle scan, the time for this is irrelevant in the backtest section, as this is always be the start of the day’s time (i.e 00 hours). If you’d want to view the actual time when the stocks are being filtered, you can create a alert on your scan that runs every 5 minutes or so, and validate the results in the alert history
i would be very happy if you put up an operator of not equal to
It is possible. You may create a sub-filter and set it to “stock fails” instead of “stock passes all”
Hello,
If i use a 5 min candle stick then the back testing is available only for 3 days which. Nothing can be done with 3 days of back testing data. Please understand. You have been saying that it will be done for a long time. But nothhing is done .
Hello,
We do plan on adding more features to it soon. Shall keep you posted.
Hello,
How can I get backtest data for 12 months?
Currenly I can see data for 7 months only.
Thanks.
We do plan on adding more features to it soon.
Hope this helps on back-testing:
It will show the previous days/ minutes results for your scan without the need for you to modify the scan. Back-testing will not give alerts. It is only to analyze/ view stocks previously triggered by your scans. If you click on any of the bars on the graph, it will show the list of stocks that triggered as per the scan previously.
Back-test data will show data for the lowest candle time frame in your scan. If lowest time frame is 1 minute, it will show results for last 1 minutes. If its on daily candle it will show data for past 6 months. We show results for the past 150 bars in our backtest section, these 150 candles could be of any timeframe, depending on the lowest timeframe in your scan, so for 5 minutes for example, you would get 2 days, for 1 minute, half a day and so on.
If you have the alert frequency of 5 minutes on a 1 hour candle scan, the alert results will update every 5 minutes and so will the backtest results(if you open the site and view the graph every 5 minutes), the difference is that the alert keeps a history of all your stocks triggered every 5 minutes i.e at 9:20am, 9:25am and so on via the alert history page,, whereas the backtest graph doesn’t keep any history as such, it will show the results only as of the candle completion time i.e 10:15am. so its not necessary that the backtest will show all the stocks that were triggered every 5 minutes as your alert show’s.
Alerts is a premium feature that would allow you to do this, it keeps a track of all your stocks that met the condition every 5 minutes so that you don’t need to keep a track of them manually in the scanner page or the backtesting graph. The backtest is a dynamic graph that would update/change as your 1 hour candle is changing.
Thanks for the great feature. Really appreciate your efforts.
Is there anyway we can download the backtest results in to an excel (as you have done for the scanner results)?
Hello,
You are most welcome. Currently we do not have this feature. We may plan on adding it in the near term. Shall keep you posted.
Not able to backtest for more than past 3 days .. how do I change this setting
Yes, currently back-test can go back upto previous 150 candles. We do plan on adding more features in near term.
how do i backtest 1 minute scans of previous one week , i do have a premium membership.
the most i can see is upto 2 hours ago
Currently back-test can go back only upto previous 150 candles (any time frame). We do plan on adding more features to the same in near term.
Every Time when I Check for Back Test, I can see results only for Previous 2 Days only.
How to set back Test for max possible duration
I m Testing for 5 Min Candle
Currently back-test can go back only upto previous 150 candles (any time frame). We do plan on adding more features to the same in near term.
Backtesting feature was very good and useful also.
Pl see if u add following facility in backtesting.
– All backtesting results in excel.
Presently I can do it for current day only.
………Thanks
We do plan on adding more features to the same in the near term. Shall keep you posted.
Sir,
Doesn’t backtesting mean that you check the list of stocks for the scanner created, and how did the stocks perform? That’s real backtesting, right?
Currently we can only display the list of stocks triggered via the scans previously. We do plan on adding more features to the same in near term.
Can i backtest a scan repeatedly while working on it
The results i am seeing seems to that its not changing.
Hello,
Yes, if you make any changes in a scan, you need to back to the back-test graph to view updated results.
Scanner backtesting results is nice feature with date …it would be more significant if scanner also capture timing beside date ..
If the scan is based on daily candles, it will only display the date. If other time frames, it will display the starting time of the candle.
When i download the csv file, it only shows the Date|Time, Stock name & sector in which the stock is.
But, the way it shows the price when screener triggers any stock, is not shown in Backtest data….
Can you please add this in suggestion box to have Price also included in downloaded csv?
This will help a lot.
Sure, shall get with the team on your suggestion.
Same thing bro according to my trading set up I got 455 stocks without any price data now i am going through every chart to check Risk reward and profit probabilities. 🙁
@Chartink please make it possible we need price and other data also
Hi Team,
What time frame does backtest use when i set ‘latest’ in my scan?
I suppose alerts timeframe has no any relation to backtest. Correct me if wrong.
“Latest” stands for current days candle (daily candle). Backtest displays results for the smallest time frame candle used. In this case, its for the daily candle.
Hello!
Not sure if this is already discussed but want to know.
After getting the list of stocks in the backtest, is it possible to see how the stock performed? As in, if I had traded based on the scan result, would I have been in profit or loss? Can it be tested in auto?
I bought premium and if this is a premium feature, I would like to use it.
Regards
Currently, we do not have this feature. Backtest as of now only displays the list of stocks triggered.
What type of backtesting is this?
What’s the use of knowing number of triggers?
Backtesting is supposed to find out profitability of the strategy.
We do plan on upgrading the same in the future. Currently, it displays only the stock symbols triggered.
Sir when I download the backrest history result the csv file does not appear as per the web page format. It doesn’t show the profitable percentage on that day or volume. It could have more useful
Currently, backtest only displays the stock symbol and not the gain/ loss %
would I be able to see the backtest results of 9 years in a one day candle timeframe in the premium subscription ??? can you kindly show me one example..
how can I see backtest result of a 5 min time frame scanner for the last 7 months?
as a free user, I’m only able to view 3 days of backtesting results.
is there a high number of backtest days available in 5 min time with a premium subscription?
Hello,
Currently, It has a limitation to see the backtest for a 5min timeframe. In the premium version for a 5min timeframe, one can see the backtest for one month.
Need volume details and %of change in back test data result, is it possible to get it
Hello,
Currently, we do not have this feature. However, we may plan on adding it in the near term & l shall keep you posted on this.
Dear sir,
we appreciate your continuous development and hard work for betterment of chart ink scanners …
Chartink scanner is more flexible and requires very limited knowledge to build complicated strategy compare to other players in the market…., but we are eagerly waiting for full flesh back testing for past 10 years or more data to test our strategy.
Hello,
Thank you for your feedback. We are happy to help you.
Yes, our team is already aware of this and we will surely keep you posted as and when there is any development on the same. I appreciate your patience.
Hi Support Team,
How do I use Chartink to backtest different set-ups on BANKNIFTY & NIFTY Indices and not stocks? Would appreciate if you guide me through it once.
Hello Akshay,
Thanks for getting in touch with us. You can scan the “nifty and banknifty” segment. After you click on ‘the cash segment in your scan, you will see all segments when clicking on “nifty and banknifty”. It allows you to verify/run the backtest results only for “BANKNIFTY & NIFTY Indices.”.
Sir please clarify that if we want 100% movers, should we write Number =1 or 2?
Hello Chetan,
I hope you received our reply in your mail; We have requested more clarification on this so we can review and respond.
I want to see only first candle of 5minute of the day. How can i ignore the lots of bar on the backtesting. I think there is custom formula of 15m but it’s not showing there. So what is the solution to see only 1st candle of 5minute of the day on backtested result.
Hello Hemant,
To obtain backtesting results for a specific candle, we can include a group of Day First Candle High that matches the current high. For example, [=1] 15 Minute High = [0] 15 Minute High and [=1] 15 Minute Low = [0] 15 Minute Low . Please find a scan attached for your reference.
https://chartink.com/screener/rsi-crossing-80-on-day-first-candle
[=1]15 minute close greater than [=1]15minute upper bollinger band (20,2)
latest close greater than number 100
latest close lesser than number 5000
bracket (latest close *latest SMA (latest volume 20) / number 1000000) greater than number 1400
hi, for how long period will I be able to backtest with above condition after buying the premium for 1 month, free version limit is 7 days .
Hello,
For the above scan if you are a premium user then you can access the back-test data up-to 4 months, and as a non-premium user the back-test data is available for 1 week.
Please add legends for the X and Y axis.
And what’s on Y axis just for my information?
Hello,
Apologies, but I’m afraid that your message isn’t entirely clear. Could you please provide more details on what you are referring to? It would be helpful if you could share an example image for reference purposes. This way, we can better understand your request.
if it doesnt show profitability of a screener or strategy then you should not call it backtest-please refund my subscription-carried away with word called backtest
Hello,
Please note that the backtest will align with the alerts if the scan has a single time frame. Can you please share your requirements to this email ID: [email protected]
There is a huge gap between alert triggered and buy signal sent time.
Hello,
This could probably be because of a scan or an alert misconfiguration, which we could investigate and correct, Please share the following details:
– URL of the scan that you are referring to?
– Share a few example stocks with us for which you should have received alerts but did not get alerts for the same.
– Share a screenshot of the alert settings for your scan. You can do so by opening your scan and clicking on the “modify alert” option, and sharing a screenshot for the same here for our reference.