Scan stocks where the 50 Simple moving average(SMA) has crossed below the 200 Simple moving average . “Crossed below” specifies that the 50 SMA was above the 200 SMA a day prior, but has closed below it today.
Updates, Tutorials & News
Scan stocks where the 50 Simple moving average(SMA) has crossed below the 200 Simple moving average . “Crossed below” specifies that the 50 SMA was above the 200 SMA a day prior, but has closed below it today.
Scan stocks where the 50 Simple moving average(SMA) has crossed above the 200 Simple moving average . “Crossed above ” specifies that the 50 SMA was below the 200 SMA a day prior, but has closed above it today.
MACD bullish and bearish breakouts, showing MACD Signal crossing above & below MACD line using the default parameters of (26,12,9)
Scanning stocks that have touched their 52-week high OR 52-week low, 52 weeks consists of 252 trading days. We’ll be using our Min/Max functions with a duration of 252 days, along with the “high/low” stock attribute, to filter such stocks.
Scanner: 52-week high/low scan
Scan stocks that have opened Gapup OR Gapdown from their yesterdays close. A stock passes these filters if it has opened 3% higher OR 3% lower when compared with its previous day close.
Williams %R ranges from 0 to -100, we search for stocks that are in the oversold(-80) region OR overbought(-20) region. Both Overbought & Oversold filters are matched via the “ANY” sub-filter condition in a single scan
The enclosed information will help you develop the skills and knowledge to create, understand, and run custom scans for technical & fundamental indicators. While reading this guide, we suggest having our scanning tool open in another window to apply the demonstrated steps, which would help you create your unique custom scans.
Chartink scanner offers unparalleled flexibility to deliver custom, accurate, and fast stock scans. Chartink’s scanner is a powerful tool that enables you to scan stocks based on the technical levels and indicators you have developed through your experience with stock markets and technical analysis. Some examples of what you can do with the scanner include listing stocks that have crossed the 200-day moving average, have RSI values greater than 70, or have the Highest volume, and many more.
The scanner allows you to customize technical (e.g., RSI, MACD, breakout..) and fundamental parameters (e.g., P/E, book value..) to suit your needs.

A scan comprises several filters, which can be added by clicking on the filter icon![]() .
.
A scan with a single filter appears as follows:
The scan, besides filters stocks whose “close is greater than 500”, notice the interface relates closely to our English language grammar –

Relates to the open, high, low, close, and volume are always prefixed by an offset that indicates whether you are looking for the current candle Value, a value of the previous candle, or a specific number of candles ago, applies to all timeframes, such as daily, Intraday, weekly, monthly.
Steps performed to add “Close” as a filter attribute. Notice the “Offset” component automatically added.

Relate to the timeframe for the indicator for the current or prior candle; often, you’d want to compare the values of a specific component from one day to another, like, referring to the RSI value of today & comparing it against the RSI value 10 days ago.
Offsets allow you to add this flexibility to your analysis, enabling you to compare components from days before the most recent trading day. This can be useful when conducting trend analysis or identifying potential opportunities in the market.
For example, you may want to identify stocks that have closed above their previous day’s close.
Hint: An offset is automatically added once you select a stock attribute or an indicator defaulting to “Latest” (current daily candle). To change, click on it(latest).

Hard-coded numbers are fixed/constant values. To create filter, you can use comparison operators (like greater than or less than) or math operations (+,-,/,** *) to create a filter.

You can add multiple indicators, such as SMA, RSI, MACD, and ADX, and perform various computations on them to filter stocks.
Most indicators require a parameter for their computations, and Chartink automatically sets a default value for the parameter when you add the indicator (shown in brackets).
You can easily change any indicator’s parameter(clicking on it) to suit your needs.
Adding SMA as an indicator(to the first line), notice the parameter for SMA i.e (close, 20), signifying the computations to be on the “close” stock attribute for the past 20 days.
Hint: If an “Indicator” requires multiple parameters, they are separated by a comma, e.g., “(close, 20)” here.
After adding a “stock attribute” or “indicator”, you may want to perform operations on them to compare them or use them in your custom criteria. These operations allow you to link indicators and other filter components together to create more complex criteria. For example, you may want to compare an indicator value to a number constant or add two indicators together.
The format for linking operations with other filter components is as follows:
indicator operation(greater than/less than) number constant ....
stock attribute operation(equals) indicator ....
number constant operation(*, /, +, -) number constant operation(less than) indicator ...
An operation can be performed by clicking on the icon. “Also, multiple operations can be performed for a single filter.
To construct more advanced scans, you can use arithmetic operations (add, subtract, multiply, divide) on filter components. This allows you to create scans for stocks that have gained a certain percentage today (e.g., 5%). The example below shows a scan that uses two operations, one of which is an arithmetic operation (*), to filter stocks that have experienced a gap up or gap down. Here is an example scan.

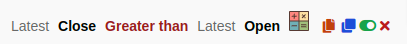
Probably the most common operation you’d use, as every valid scan requires a comparison among 2 filter components. A single filter can have only a single comparison. In the below snippet, the “greater than” operation denotes the relation between the 2 stock attributes(close & open) & filters stocks that have a “Close” greater than a stock’s “Open.”; here is an example scan.
Often you’d want to filter stocks based on certain breakouts, which can occur when a stock closes below a certain value yesterday but closes above it today (signifying a crossover). [Value here refers to any indicator or stock attribute.] here is an example scan.

The above would filter Stocks that closed below the 20- day SMA yesterday but today it closed above the 20-day SMA (crossing over from below).
To filter stocks that are closing above 5,000, you can perform the following operation:

Steps to create the scan
Normally you’d want to have multiple filters specified in a single scan. To add more than a single filter again, click on the filter icon and select a new filter to add.
i.e., You can change the filter’s behavior within a scan to achieve an AND or an ANY condition or even have it fail a certain filter within your scan.
Sometimes it may be necessary to group filters and their behavior to create more complex criteria.

In this scenario, we can see that the main group condition passing is “latest close > 200”. This condition is a must. 2 sub-filters or sub-groups are created after that, out of which the scan passes any 1 of the 2 groups along with the main condition “latest close > 200”. You can see the sub-groups are highlighted and are being passed in a “Passes Any” join.
Scan for EMA 20 with volume OR close crossing EMA 20 where RSI above 70
The Min and Max filter components are unique because they accept other filter components as parameters. These functions are useful for calculating the highest or minimum values over a specified number of days. These functions take two parameters, as follows:

To identify stocks that have reached their 52-week High on a given day, the Max(period, measure) function can be used.
After selecting this function, its required parameters will be automatically added. These parameters can be modified by clicking on them; in this case, they should be changed to 252 and High.
The measure selected, in this case, High is used to identify stocks at their 52-week High, which consists of 252 trading days.
This allows for identifying stocks that have reached this milestone on the specified day(latest).
Examples with scans –
We’ve compiled a few examples to help you design your custom scans. Click here to view more example scans. You can also browse through the scans created by other users here.
List stocks that have RSI(14 days) changed their zone from below 70 yesterday to above 70 today, indicating they are likely to see entering to overbought zone. Here is an example scan.

List stocks that have RSI(14 days) changed their zone from above 30 yesterday to below 30 today, indicating they are likely to see entering the oversold zone. Here is an example scan.

Listing stocks with an open greater than 3% of yesterday’s close. If a stock closed at 100 INR yesterday, Its open today should be greater than 103, denoted by “1 day ago Close * 1.03”. Here is an example scan.
![]()
Listing stocks with an open of less than 3% of yesterday’s close. If a stock closed at 100 INR yesterday, Its open today and should be less than 97, denoted by “1 day ago Close * 0.97”. Here is an example scan.
 stocks")
Often a crossover of 50-day SMA over 200-day SMA is treated as a bullish signal. Here is an example scan.

Examples and usage of fundamental filters can be found here.
Kindly refer to our FAQ page for further queries. If you have any suggestions/doubts, kindly contact us.
We hope that this guide provides a solid foundation for creating custom scans and helps you make informed trading decisions.