Exchange is conducting an maintenance activity that would impact impact the avaliablitliy of these fields for 2 days, i.e 27th and 28th Sep’21. We’ll be restoring this missing data as soon as we get a update from exchange.
In the meantime, please disable the filters of “Trade & Order book” fields in your scans and widgets, to ensure that this doesn’t impact your scans & alerts due to non avaliablity for these 2 days, below is the list of fields impacted by this activity:
Buyer initiated trades
Buyer initiated trades quantity
Buyer initiated trades average quantity
Seller initiated trades
Seller initiated trades quantity
Seller initiated trades average quantit
Buyer vs Seller initiated trades ratio
Buyer vs Seller initiated trades quantity ratio
Buyer initiated trades VWAP
Seller initiated trades VWAP
Total Orders
Orders Quantity
Buy Orders
Buy Orders Quantity
Sell Orders
Sell Orders Quantity
Buy vs Sell orders ratio
Buy vs Sell orders quantity ratio
Cancelled Buy Orders
Cancelled Buy Orders Quantity
Cancelled Sell Orders
Cancelled Sell Orders Quantity
Total Cancelled orders
Total Cancelled orders quantity
Cancelled orders ratio
Cancelled orders quantity ratio
Buy Orders Vwap
Sell Orders Vwap
Orders Vwap
Note: Candlestick data(open,high,low,close..) & other technical indicators(RSI, MACD.. etc) would NOT be impacted by this.
Updates
29th Sep’21 9:20am: The issue is still not resolved, we have notified the exchange regarding the same
29th Sep’21 10:20am: The issue now resolved & these fields are now avaliable, the exhange is working on providing us with the missing data
We are facing issues for trade & order book fields from the exchange starting 31st Aug’21, the exchange has been notified and they are working to fix it.
9:35am – NSE has acknolwdged the issue impacting other clients as well
9:38am – NSE has notified a issue with the AWS feed connecting the exchange
11:37am – NSE has resolved the issue, we’ll be working with shortly to get the missing data
Exchange is conducting an unannounced activity that would impact impact the avaliablitliy of these fields. We’ll be in touch with the exchange to restore the data for these fields today after market hours
In the meantime, please disable the filters of “Trade & Order book” fields so that this doesn’t impact your scans due to non avaliablity of data for today
Update 30th May’21 – We are still awaiting the data from NSE on this.
We’ve recently added the ability to scan over 400+ fields including fields from Balance seet, Cash flow, P&L & shareholding pattern. Below are a few scans, dashboards showing usage of these new fields:
We are seeing issues while reaching our site on jio/vodafone internet connection, we have reached out to these providers to help resolve this issue as it relates to a network server issue.
We have already raised a ticket with our network provider & they are seeing this issue with other sites as well, including sbicards.com, opera.com and so on.. this issue is something not within our control as it depends on other upstream network providers.
Their team is still investigating on the root cause for the same, may I suggest you to use:
A different network connection, if possible.
Use a proxy site or use opera as it comes with free VPN
We are in constant touch with our provider and shall let you konw as soon as we hear back from them, until then, please use the above methods to visit our site
Aug 18th’20: 12:30pm -> The issue is now solved across all providers, we have also taken necessary steps to avoid this in future, including migrating to a different network provider, if necessary.
We have recently released major scanner updates, the post summarizes their usage & benefits:
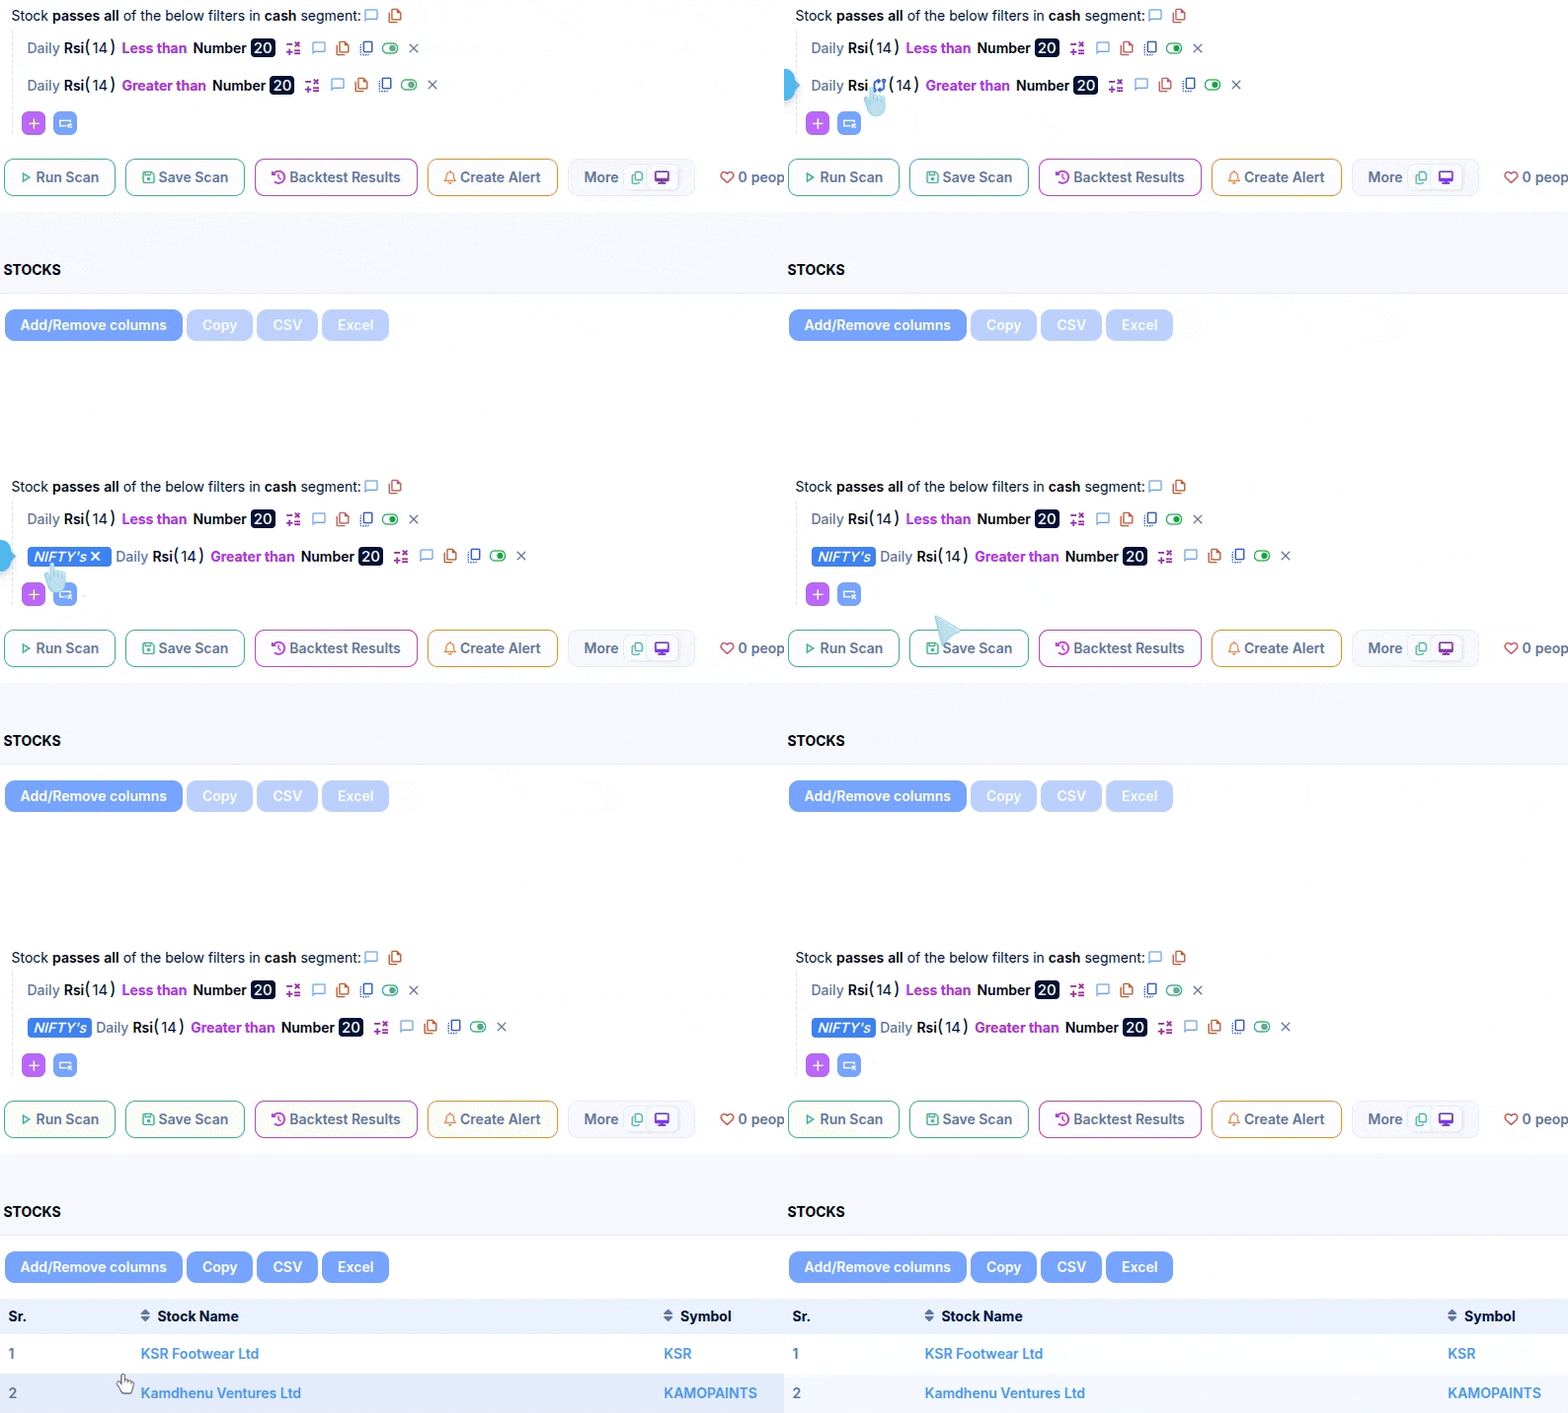
Drag and Drop filters across groups or re-arrange them across the scan
Duplicate group or a single filter
Copy the filter to clipboard
Count & Countstreak functions
Least & Greatest functions
Drag and Drop filters across groups or re-arrange them across the scan -> Allows to you drag and drop across different groups to make re-oraganinzing a scanner, press left mouse button and drag/move your while the button is pressed to move the filters, sample video below,
Duplicate group or a single filter -> Duplicate a filter or a group by clicking on the copy icon as seen below
Copy the filter to clipboard -> Copy filter text to clipboard by clicking on the “word” icon, as seen below
Count & Countstreak functions -> Helps you to count the total number of times a given filter in the past candles Count eg: ->Filter “Latest count( 50, 1 where latest close > latest upper bollinger band ( 20 , 2 ) ) greater than equal to 2” will return all stocks that have closed above the upper bollinger band for 2 or more days in the past 50 days
Countstreak eg: -> Filter “Latest countstreak( 20, 1 where latest close > latest sma ( latest close , 200 ) )greater than equal to 10” will return all stocks that have continesouly(in a streak) closed above its 200 SMA for the past 10 or more candles(daily timeframe)
Least & Greatest functions -> Helps to get the greatest or the least of a given set of filters
eg: greatest( Latest Open, Latest Close ) will return the greatest value from either the open or the close
We hope these additional features will further simply your scanner creation. If you do have any queries please feel free to leave a comment here or reach us at [email protected]
NSE is facing a issue that’s causing missing data for today(Nov 19 ‘2019, we are co-oridnating with the exchange to sort this from their end.
Please note that this is not within our control and we are hoping our best this is resolved from NSE ASAP, we are continuously following up with NSE to have this fixed
Update 9:15am -> Notified NSE about the issue
Update 9:20am -> Confirmed from NSE this issue impacts other vendors too & their technical team is working to resolve it
Update 10:30am -> NSE is still working to resolve this
Update 11.02am – > We have started receiving data. We are trying to recover previous data (9.15am to 11.01am)
Update 20th Nov’19 -> NSE is still working to recover the missing files.
Update 22nd Nov’19 -> The missing data is now added on our site
The backtesting feature enables you to validate your stock against historical data, ultimately improving the accuracy used in the scan.
How to verify the stocks in the backtest?
We offer a “Backtest Results” option for all scans, which is located below the scan conditions (pink button).
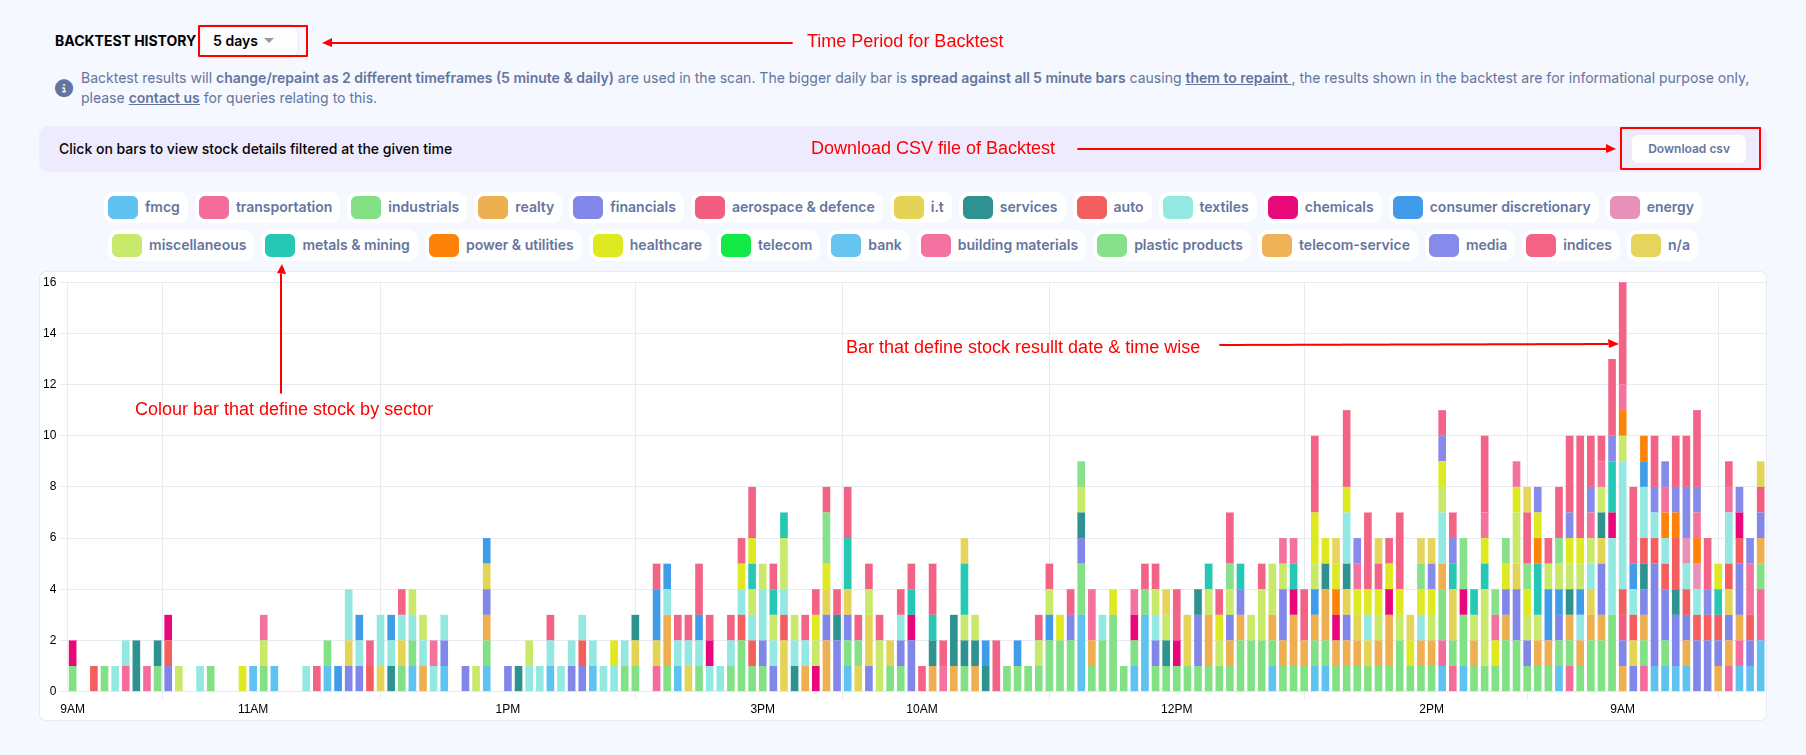
This feature enables you to view the backtest bars, where you can select a specific date and time to see how many stocks fulfilled the scan conditions at that point in time.
Upon clicking on the bars, you can access the stock names (SYMBOLS) and click on them to redirect to the charts.
Here I have attached an image below & a video tutorial on this for reference – Verify Backtest
What is the backtest history limit for different timeframes for scans?
The backtest bars are always based on the smallest time frame you choose in the scan. Below, I’ve included a list of scan timeframes with the corresponding maximum backtest period –
5 minutes – 3 Weeks
15 minutes – 3 months
30 minutes – 7 months
1 hour – 1 year & 4 months
Daily – 9 years.
Note – Backtest is limited to the first option only from the dropdown(Backtest history limit).
Do Backtest results keep updating/repainting?
Assuming the scan is made of different types of timeframe conditions, shown below –
5-minute close greater than the previous 5-minute close
In this type of condition, You may ignore the backtest results as they may not always be accurate due to multiple time frame candles used in the scan(5-minute and daily candles). Backtest results use a higher timeframe(daily) candle that would spread for all bars within the backtest history. As long as the higher timeframe candle is incomplete, all bars in the backtest would also change/update, leading to potential inaccuracies.
In contrast, the alerts you receive for this scan are accurate and sent instantly once any stock matches all scan criteria.
Why do the Volume conditions affect my backtest results?
When using volume as a condition in the scans, it’s possible that some stocks may not immediately appear in the results when verifying with backtests. This is because the volume condition takes time to fulfil.
For example, if we have a scan with two conditions, such as a “15-minute RSI crossed above 60 and daily volume above 1 Lakh“, Let’s say the ABC stock fulfils the RSI condition at 9:30 AM, but the volume condition is not yet met at that time. Due to this, the stock ABC will not show in the backtest.
However, if ABC meets all conditions later in the day (e.g., at 11 AM), the backtest will reflect the ABC stock in the backtest at 9:30 AM. So, if you want to avoid this behavior, you can disable the volume condition.
Backtest results timing not matching alerts?
I assume you were comparing the backtest result time with the alert time. Note that the backtest will show the candle start time, whereas the alert you received is on the completed candle when a stock matches all the criteria.
To explain it in more detail, if you have a scanner for a condition such as “1-hour RSI greater than 60” and received an alert at 09:45 AM (assuming an alert time interval of 5 minutes), the backtest result will show 09:15 AM, which starts the time of the 1-hour candle. Hence the backtest always shows the start time of that candle, whereas the alert you received is on the completed candle.
Note, If you are using a 15-minute timeframe in your scan, then you should set your alert time interval to 15 minutes as well. This will ensure that you receive alerts based on completed 15-minute candles that satisfy the scan criteria.
Stocks showing in backtest but did not get an alert for it?
The reason for the discrepancy in the backtest results is that the scan is using the weekly and monthly timeframes, and when we are running the scan between the week/month. As a result, the scan is showing results based on an incomplete weekly/monthly candle. This causes the results in the backtest to continue to repaint/updated until the weekly and monthly candle completes its formation.