Scans can now be created using a mix of Fundamental & Technical indicators. Fundamental parameters in scan can be validated against our fundamental page.
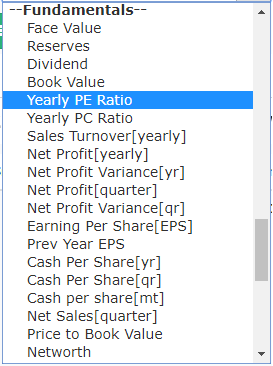
Example fundamental scans can be found here. We have the following list of fundamental indicators as of now:
Results for Consolidated figures in Rs. Cr.
-
- Face Value
- Reserves
- Dividend
- Book Value
- Yearly PE Ratio
- Yearly PC Ratio
- Sales Turnover[yearly]
- Net Profit[yearly]
- Net Profit Variance[yr]
- Net Profit[quarter]
- Net Profit Variance[qr]
- Earning Per Share[EPS]
- Prev Year EPS
- Cash Per Share[yr]
- Cash Per Share[qr]
- Cash per share[mt]
- Net Sales[quarter]
- Price to Book Value
- Networth
- BSE Value in lakhs
- NSE Value in lakhs
- Market Cap
- Operating profit margin[yr]
- Operating profit margin[qr]
- Gross profit margin
- Gross Block
- Total Loans
- Advance Given By Bank
- Net non performing assets
- TTM – Trailing 12 months Sales
- TTM – Trailing 12 months Operating Profit
- TTM – Trailing 12 months Operating Profit margin
- TTM – Trailing 12 months Gross profit
- TTM – Trailing 12 months Gross profit margin
- TTM – Trailing 12 months Net profit
- TTM – Trailing 12 months Net profit Variance
- TTM – Trailing 12 months EPS
- TTM – Trailing 12 months PE
- TTM – Trailing 12 months CPS
- TTM – Trailing 12 months Depreciation
Fundamental parameters can be added on create scan page after clicking the filter icon
Hi,
In Fundamental scanner, I would like to filter
stocks Latest Net Profit[quarter] Greater than 1 quarter ago Net Profit[quarter] + 2 quarter ago Net Profit[quarter] + 3 quarter ago Net Profit[quarter]
We are populating our database for historic data, soon they’ll be available along with years
Is above qry possible ?
Sir please guide me how to apply chartink.in
hi ,
can you give alert facility to mobile?
it will be much beneficial …..
We’ll be adding that soon
If possible, introduce option scan with strategies. This will require higher database but it will improve site visits.
There are many scans which is still not possible in this since the program does not allow combination of two filters to simultaneously work for example, if one wants to know the stocks whose RSI is between 70 to 80 but Day before it was between 60 to 70 and the stock is also nearing its day’s high. It’s not possible to write such complicated but advanced scan. So please introduce such programs.
You can add multiple filters to achieve this and compare today’s RSI values along with yesterday’s RSI values
What is the indicator i should use for ROE
Also please create the Between Operator
We don’t have ROE yet, we’ll plan on adding that in future
Between operator is nothing but a combination of >= and <=. You can group those 2 filters to workaround the between operator.
Hi Akash,
It would be great if you also introduce some industry data too. For ex : Company PE less than Industry PE
Yes, good idea. We’ll be adding more financial data soon
Which indicators use to stock selection.
Which indicators use to stock selection.
Which parameter used to stocks.
You can refer some sample scans here: https://chartink.com/screeners
How did the selected the stock.
You can refer some sample scans here: https://chartink.com/screeners
How to prepare watchlist?
You can create and manage watchlist here: https://chartink.com/watchlist_dashboard
Comparison of current RoE with those of the previous 3 – 4 years and comparison of current EPS with those of the previous 3 – 4 years is not possible.
We’ll be adding more financial data soon
I guess it’s not the perfect place to ask but are there any plans for a Chartink app on Android? Please do make it as that would be way more handy and fast
It is in our todo list, we’ll keep you updated once we have launched it
What indicator to use for knowing equity base of companys
Can you please elaborate what you mean by equity base, do you mean market cap?
Fundamental scanning is great if it works well. User need to be supported for time to time guidance during usage.
thanks for making this excellent tool for us i want to know how we can filter book value > CMP bcoz CMP option is not avaiable in the filter list
thanks once again
You can refer the “Latest close” for the CMP as that’s the latest value of a stock in a given day
Sir, I m thankful for this excellent site, Please assist me Which filter should I use to find fundamental strong multibagger stocks, which are in sideways since long time and strong potential to move up in near future?
You can start by viewing our fundamental scans here: https://chartink.com/screeners/fundamental-screeners
Sir, i want to scan last EPS is greater then previous EPS please tell me how
We don’t have this provision as of now, however, we plan on adding historic data for this too soon
Hi,
I want to compare the EPS quarter over quarter and Year over year How can one do that? and what is TTM P.E?
We don’t have this provision as of now, however, we plan on adding historic data for this too soon
Hi, I want to filter companies whose sales have increase by 20%, so my query should be
Sales TTM Sales Greater than Turnover[yearly]*NUMBER 1.2
But in the examples of scans I see the following
Sales Turnover[yearly] Greater than TTM Sales*NUMBER 1.2.
Isn’t TTM = sum of latest 4 quarters and Turnover[yearly] last financial year? Kindly suggest.
**Correcting a typo in the above msg**
Hi, I want to filter companies whose sales have increase by 20%, so my query should be
‘TTM Sales’ Greater than ‘Sales Turnover[yearly]’ * NUMBER 1.2
But in the examples of scans I see the following
‘Sales Turnover[yearly]’ Greater than ‘TTM Sales’ * NUMBER 1.2.
Isn’t TTM = sum of latest 4 quarters and Turnover[yearly] last financial year? Kindly suggest.
Yes, you are correct. You can use the yearly results as you’ve mentioned and multiply it by 1.2% for a 20% increase. If you want to compare the latest financial years sales up by 20%, you would need to use ‘Sales Turnover[yearly]’ Greater than ‘TTM Sales’ * NUMBER 1.2.
Hi Akash- great scanner with self-intuitive interface!
Tried using the Market Cap in the scan, but not sure if the number I type in represents crores, lakhs or thousands.
For example I tried filtering by market cap above 100 crores by typing 100,00,00,000 and the results came up empty. Can you throw some light on this?
Also, how is the market cap itself calculated? Is it a fairly static field in the database, or is it dynamically calculated based on the latest price (close)?
Its in Cr.
They have mentioned in headline of the list.
Hello,
Hope MK’s reply helped. Below is an example scan:
https://chartink.com/screener/market-cap-greater-than-500-billion
Its in Cr.
They have mentioned in headline of the list.
Thanks.
I would like to know what Net Profit variance means. How would I filter companies registered profit jump by certain % yoy or qoq. I saw few samples which compare TTM again net profit yearly, but the results are not as intended.
Net Profit variance compares the actual with the budget values, we currently don’t have historic data for profits, but we’ll plan on adding that shortly
Can you please add more fundamental indicators like ROE, ROCE, ROA, Historic values and 3,5,10 years average, Debt to equity ratio, Interest coverage ratio etc. These parameters will make the fundamental scan more effective, otherwise parameters available till now are quite limited.
We do plan on upgrading our fundamental data by next month.
Please do let us know if this data is available or being made available
Yes, its available. You can view the new fields in the drop down menu in scans.
Found ROCE Couldn’t find ROE. Also add Free cash flow for 5,10 years
what is the meaning of TTM CPS , for which purpose , it is used?
Hi – i am looking for the following scan to filter stocks .. is there a way to achieve this ?
1) Only NSE Stocks
2) ROE >15%
3) EPS Growth Rate >15% ( Qtr on qtr )
4) Sales Growth Rate >17% (Qtr on Qtr)
5) Sales Growth Rate >17% ( Year on year)
Below is your scan:
https://chartink.com/screener/scan-for-manoj-fundamental
In the scan change 15 to 1.15 and 17 to 1.17 to get your intended increase of 15 and 17 percentage, respectively
Thank you for highlighting the same. It has been corrected.
Another question – Screener for
1) 10 , 20 , 50 and 200 day cross over
2) ADX strong
3) Relative Strength ( optional)
You need current price crossing above all 4 emas?
When will yearly financials of a company be updated ? All i could see is last year financials.
need detailed guide on using each how to chk ttm %
Below is an example scan for the same:
https://chartink.com/screener/quarterly-ttm-and-yearly-operating-profit-margin-net-profit-margin-net-cash-flow-1
There is a typo in this article’s heading. “available” is misspelled as “avaliable”
How do I represent Dividend Yield in terms of percentage in a fundamental scan? For ex, I want to filter out only the companies that are providing a dividend yield of 1.5% or above.
HOW TO ADD TIME OF THE SCAN COLUMN IN THE SCREENER SO THAT AS PER THE TIME WE CAN WATCH THE PARTICULAR ROW
Hello,
Currently, we do not have this feature. We may plan on adding it in the near term. Shall keep you posted.
Custmer care
Hello,
Currently, we provide only email support, please feel free to share your doubts here.
Hi – i am looking for the following scan to filter stocks .. is there a way to achieve this ?
1) NSE /BSE Cash Stocks
2) Sales for latest qtr = greater Than all qtr
3) profit for latest qtr = greater Than all qtr
4)OPM >= 15%
5) MCAP >500 cr < 15000 cr
Hello,
1. We currently support only NSE cash stocks and indices; we plan to add others stocks and indices too shortly.
2. Currently, we do not have all time feature. We need to enter the previous “n” number of data to check the results. Below is an example scan as per your requirements. kindly review:
https://chartink.com/screener/operating-margin-greater-than-equal-to-15
hi
is there normal pivot level R3, R4, S3, S4 also how to find Fibonacci levels
Can I apply following criteria Shareholding Fii increasing or dii increasing or public decreasing and reserve increasing?
Hello,
Here is your scan, kindly review it-
https://chartink.com/screener/hareholding-fii-increasing-or-dii-increasing-or-public-decreasing-and-reserve-increasing
Hi, how to filter stocks based on this criteria as defined for Bulk Deals.
“A bulk deal in the share market is a deal where the total quantity of shares bought or sold is greater than 0.5% of the share capital of the company.”
So, how to filter such stocks where in the last 5 minutes a bulk deal as per above definition was executed?
Thanks
SVS
Greetings!
At this moment, we do not offer the feature you mentioned. Nonetheless, we are actively exploring the option of adding it along with new indicators.
I am unable to provide a specific timeline for the addition of this feature, but I have forwarded your request to our Development team for future consideration.
We value your patience and look forward to enhancing our service for our valuable users.
whether these scans works on BSE listed stock.
Hello,
We currently support only NSE cash stocks and indices; we plan to add BSE cash stocks and indices too shortly.
Hello Sandeep, We currently support only NSE cash stocks and indices; we plan to add Global stocks and indices too shortly.
At what price and time buy trigger is given for Canara Bank on 11.9.21
Link is attached here.
Hello Pawan,
I wanted to bring to your attention that we have responded to the ticket you raised. I trust that you have received our reply in your email.
I wish to code following ,How can i code it using chartink Editor
Current price > High price all time*0.85 AND
Piotroski score >7 AND
Profit growth >15 AND
OPM >15 AND
Market Capitalization >100 AND
Market Capitalization 50 AND
RSI 0
Hello,
This can be done with the help of a custom indicator/formula. Here is an example scan for your reference:
https://chartink.com/screener/fundamental-scan-with-piotroski-filter
Note: In the above scan, we have considered the annual values for the profit growth and OPM. Can you please elaborate more on RSI 0 and market cap 50?
To use this custom indicator, you can “Copy scan” scan & make changes. You can view the logic of the custom indicator by clicking on the purple sign(>>) next to the indicator.
Also, you can create your own custom indicator by copying/pasting the logic from the indicator shared here: https://chartink.com/indicator
Once you create your custom indicator, it should be visible in the dropdown list under “derived/custom indicators”. Here is a short video on how this can be done.: https://drive.google.com/file/d/1bnr1ahmajyXIpBRE69ese60sm7541-14/view?usp=sharing
piotroski has 9 meyrics, why does the above piotroski link only have 8 components? is there a specific reason for this?
why does the current piotroski have 8 components instead of the original 9?
Hello,
Can you please share all the 9 metrics to this email ID: [email protected]. We can surely try to create the scan for the same.
This is pine script, I need to create a scanner for this? how to I create custom indicator for this?
//@version=3
// Copyright (c) 2018-present, Alex Orekhov (everget)
// Adaptive Moving Average script may be freely distributed under the MIT license.
study(“Adaptive Moving Average”, shorttitle=”AMA”, overlay=true)
length = input(title=”Length”, type=integer, defval=14)
fastLength = input(title=”Fast EMA Length”, type=integer, defval=2)
slowLength = input(title=”Slow EMA Length”, type=integer, defval=30)
highlightMovements = input(title=”Highlight Movements ?”, type=bool, defval=true)
src = input(title=”Source”, type=source, defval=close)
fastAlpha = 2 / (fastLength + 1)
slowAlpha = 2 / (slowLength + 1)
hh = highest(length + 1)
ll = lowest(length + 1)
mltp = hh – ll != 0 ? abs(2 * src – ll – hh) / (hh – ll) : 0
ssc = mltp * (fastAlpha – slowAlpha) + slowAlpha
ama = 0.0
ama := nz(ama[1]) + pow(ssc, 2) * (src – nz(ama[1]))
amaColor = highlightMovements ? (ama > ama[1] ? green : red) : #6d1e7f
plot(ama, title=”AMA”, linewidth=2, color=amaColor, transp=0)
Hello,
The pine script that you have shared has a variable names ‘ama’ which is self-referencing. So, this indicator won’t be possible.
Is it possible to get results of only those which have posted their recent financials.
E.g. Net Profit % increase 1.5 times in Quarter March 2024. So that only company which have posted their March 24 results and have NP% increase 1.5x will show.
Hello,
This won’t be possible. If the company did not release any report then for that stock the scan will consider the 2nd quarter as the recent one. If they released the 3rd quarterly report then the scan considers that as the current quarter.
If you want we can create the scan for the same as per the above logic.
Do we have explanation of fundamental parameters like Net Profit Variance[yr]?
Is it possible to filter out stocks which has results declared today
one way to do is to check data like daily net profit change wrt 1 day ago
but daily tf is required for this which is currently not available for fundamental
why all conditions for all pass written in screener is not giving correct list of stock. it showing some condition passed but other condition has no effect.
Hello,
Can you please share more details on this? You can directly share this via email to [email protected]
unable to find stocks that listed only in BSE
Hello,
We currently support only NSE cash stocks and indices; we plan to add Global stocks and indices too shortly.