Starting 2017, Chartink.com launched custom technical stock screener for NSE/Indian Stock markets. Our screener lets you fully customize & build custom stock scans. So, if you are looking for any technical breakouts or automate your buy/sell signals our scanner can help. Start using it today for free.
Stocks in uptrend
Stocks that have been closing above their previous days close continuously for the past 5 days.
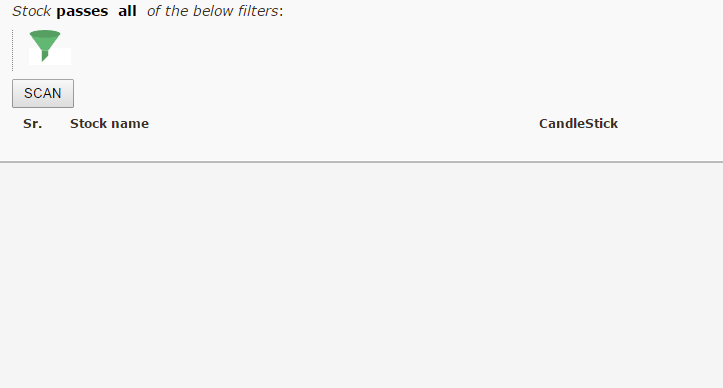
Doji pattern scan
Doji pattern where the open of a stock equals its close, the high is greater than the close & low is less than the close.
Stocks with rising/failling prices and increase in volume
This is a combination of 2 scans, “Stocks with rising prices & increase in volume” & “Stocks with falling prices & Increase in volume”. This example show’s how multiple scans can be combined into a single scan, showing stocks from both of the 2 individual scans.
Notice the use of a new sub-filter, with ANY to specify if either of the 2 filters below it is true.
Stocks falling with increase in volume
Filter stocks that have seen an sudden rise in their volume by over 5x times the average volume over the past 10 trading sessions and have dropped more than 5% today.
Stocks rising with increase in volume
Filter stocks that have seen an sudden rise in their volume by over 5x times the average volume over the past 10 trading sessions and have gained more than 5% today.
Bearish “Death Cross” scan
Scan stocks where the 50 Simple moving average(SMA) has crossed below the 200 Simple moving average . “Crossed below” specifies that the 50 SMA was above the 200 SMA a day prior, but has closed below it today.
Bullish “Golden Cross” scan
Scan stocks where the 50 Simple moving average(SMA) has crossed above the 200 Simple moving average . “Crossed above ” specifies that the 50 SMA was below the 200 SMA a day prior, but has closed above it today.
Bullish/Bearish MACD Signal Cross
MACD bullish and bearish breakouts, showing MACD Signal crossing above & below MACD line using the default parameters of (26,12,9)
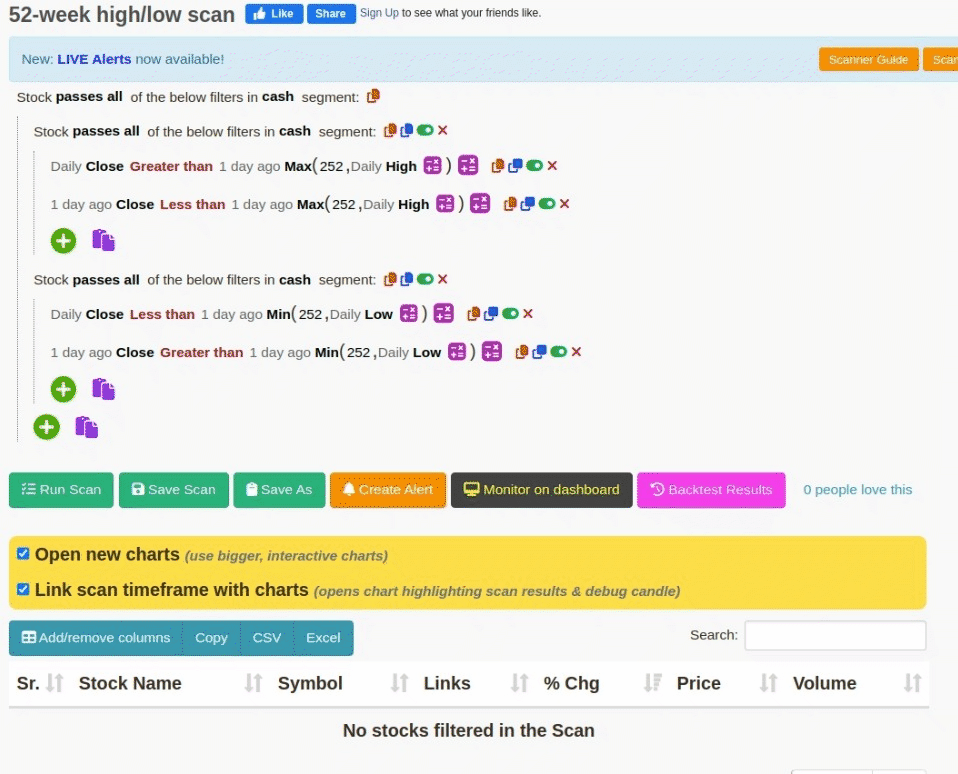
52-week high/low scan
Scanning stocks that have touched their 52-week high OR 52-week low, 52 weeks consists of 252 trading days. We’ll be using our Min/Max functions with a duration of 252 days, along with the “high/low” stock attribute, to filter such stocks.
Scanner: 52-week high/low scan