Webhook support for Alerts

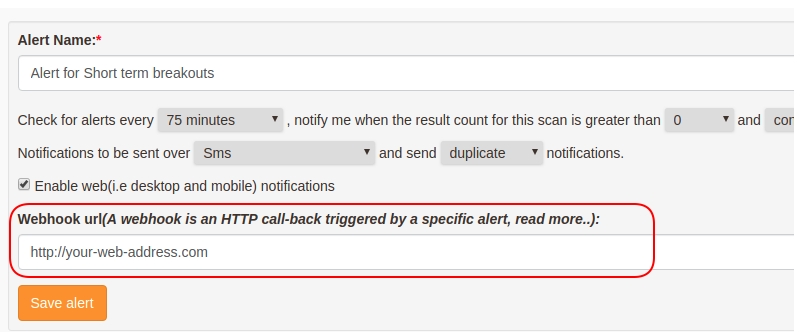
We’ve added the ability to add webhook’s for your alerts. A webhook is an HTTP call-back triggered by a specific event(in our case a alert), these can be used by your own application to monitor, place automatic orders.. etc. You can add webhooks for any given alerts by entering the URL for your web address(prefixed by http, https), this can be done by clicking on “Create/Modify Alert” right below your scans:

SAMPLE Post Data(json)
{
    "stocks": "SEPOWER,ASTEC,EDUCOMP,KSERASERA,IOLCP,GUJAPOLLO,EMCO",
    "trigger_prices": "3.75,541.8,2.1,0.2,329.6,166.8,1.25",
    "triggered_at": "2:34 pm",
    "scan_name": "Short term breakouts",
    "scan_url": "short-term-breakouts",
    "alert_name": "Alert for Short term breakouts",
    "webhook_url": "http://your-web-hook-url.com"
}

Webhooks will triggered along side your alert settings, eg: sending alerts over Email/SmS/Desktop would continue as normal

Note on automating trades with webhooks, requires some programming logic so that you can incoporate our webhooks within your application which is alreadying using API’s from the stockbrokers to place orders. Your system/application must be deployed on the internet and reachable by a domain or a IP address, this requires your application to support the ability to receive incoming POST request‘s so that we can send our JSON data for the alert

We recommend using a service like Hookbin to test the webhooks feature, it allows you to create a endpoint, which you can add in our “webhook url” field within the alert form. An HTTP POST request will be made to the URL you have specified along with the data corresponding to the alert.

Change colors for table columns, line, bar and Pie charts

We’ve released support to change/customize colors for widgets, including table colors for table columns, line, bar and pie charts. Below is a demo showing the process to change colors:

Customizing colors as per your needs would help you easliy identify the levels/columns that interest you first. Color changes can be made to Tables as well any types of Chart(pie/line/bar/area).


Now create your own Custom Indicators !

We’ve recently added the ability to create your own custom/derived indicators using existing indicators.

For example, you may have your logic of HLC3 as is “high  + low + close / 3” & would want to use this across multiple filters in different/same scans/widgets. Until now, you’d need to copy/write the logic whereever it would required.

With “custom indicators”, you can simply define its logic as:

HLC = ( current candle high + current candle low + current candle close ) / 3

Here’s the custom indicator for the above logic: https://chartink.com/indicator/hlc3

The above created indicator can then be used to create new scans/widgets: https://chartink.com/screener/close-above-hlc3 (notice the HLC indicator selection)

These are similar to having a value saved in a variable/temp working space and then using it across in multiple scans. Note, while using it across scans, you can select the timeframe for its calcuation, eg: Daily/Weekly/Monthly or Intraday candles giving you further flexibility.

To access a previous candle for a given timeframe, you can select “1/2.. candles ago”.

Below is another example from one of our users:

EOM – CUSTOM INDICATOR LOGIC
Scan using SMA on EOM(custom indicator)https://chartink.com/screener/eom-greater-than-20


Scanner updates

We have recently released major scanner updates, the post summarizes their usage & benefits:

  1. Drag and Drop filters across groups or re-arrange them across the scan
  2. Duplicate group or a single filter
  3. Copy the filter to clipboard
  4. Count & Countstreak functions
  5. Least & Greatest functions
    1. Drag and Drop filters across groups or re-arrange them across the scan -> Allows to you drag and drop across different groups to make re-oraganinzing a scanner, press left mouse button and drag/move your while the button is pressed to move the filters, sample video below,
    2. Duplicate group or a single filter -> Duplicate a filter or a group by clicking on the copy icon as seen below
    3. Copy the filter to clipboard -> Copy filter text to clipboard by clicking on the “word” icon, as seen below
    4. Count & Countstreak functions -> Helps you to count the total number of times a given filter in the past candles
      Count eg: ->Filter “Latest count( 50, 1 where latest close > latest upper bollinger band ( 20 , 2 ) ) greater than equal to 2” will return all stocks that have closed above the upper bollinger band for 2 or more days in the past 50 days

      Countstreak eg: -> Filter “Latest countstreak( 20, 1 where latest close > latest sma ( latest close , 200 ) )greater than equal to 10” will return all stocks that have continesouly(in a streak) closed above its 200 SMA for the past 10 or more candles(daily timeframe)

    5. Least & Greatest functions -> Helps to get the greatest or the least of a given set of filters
      eg: greatest( Latest Open, Latest Close ) will return the greatest value from either the open or the close

We hope these additional features will further simply your scanner creation. If you do have any queries please feel free to leave a comment here or reach us at [email protected]


New indicators & timeframes avaliable

The following indicators are added as per user request

  1. HMA (Hull moving average)
  2. VWMA (Volume-weighted moving average)
  3. Tema(Triple EMA)
  4. CMF(Chakin Money flow)
  5. AccDist(Accumulation & Distribution)
  6. Sum(total for the given period)
  7. Cmf(Chakin money flow)

Timeframes added:

  1. 25 minutes
  2. 45 minutes
  3. 3 hours

Example dashboard: https://chartink.com/dashboard/5832

The above features are avaliable for our Screeners and Atlas widgets.

NSE Data feed issue from Exchange

NSE is facing a issue that’s causing missing data for today(Nov 19 ‘2019, we are co-oridnating with the exchange to sort this from their end.

Please note that this is not within our control and we are hoping our best this is resolved from NSE ASAP, we are continuously following up with NSE to have this fixed

Update 9:15am -> Notified NSE about the issue

Update 9:20am -> Confirmed from NSE this issue impacts other vendors too & their technical team is working to resolve it

Update 10:30am -> NSE is still working to resolve this

Update 11.02am – > We have started receiving data. We are trying to recover previous data (9.15am to 11.01am)

Update 20th Nov’19 -> NSE is still working to recover the missing files.

Update 22nd Nov’19 -> The missing data is now added on our site

Media updates on the issue:

https://www.thehindubusinessline.com/markets/stock-markets/nse-trading-disruption-brokers-shoot-off-complaint-letter/article30018153.ece

https://www.moneycontrol.com/news/business/brokers-write-to-nse-complain-of-losses-after-technical-glitch-bourse-blames-vendor-4655751.html

Feature – Copy Widget

Now copy custom tables/charts from any scanner or dashboard and create your own custom widgets via our “Copy” feature, this allows you to build on existing charts/tables as per your view. Start by coping widgets from our top dashboards here: https://chartink.com/atlas


Widgets can be copied over by clicking on the “Copy” button and selecting the dashboard you’d want to copy to. Custom changes can be made once a widget is copied to your dashboard.

Launching Chartink Atlas

Atlas allows you to view a complete picture of the market on a single screen with auto updates. All dashboards can be customized to show information that you are most interested in, including RSI crossovers, Volume breakouts, Povit points and so on.

Features provided by atlas include:

  • Customize scan result columns, eg: Adding RSI as one of the result columns
  • Create new dashboards with custom scans/charts or tables3
  • Auto updates for premium members
  • Ability to drill down by clicking on the sector/industry or market cap names3
  • Sort scan result tables by any columns, like highest RSI, top % change, volume ..etcWe’ve created a few sample dashboards to help you monitor the markets:

* Intraday Market overview
* Volume Shockers
* Pivot points
* Daily Market overview
* Fundamental overview

Also note that you can drill down further to any of the sectors, marketcaps or indsutry by simply clicking on a bar/pie chart, eg:

We’ll soon be adding tutorials on the steps required to create your own custom scans/charts & tables for more insights on the markets.

Difference in Backtest vs Alerts history

Assuming you have a scan that use’s daily candles and you have a alert as well for this scan that runs every 5 minutes, the results that you see during market hours in the backtest and your alert history, will change, for the current day(as the candle is still being made while the markets are open).

While calculating the backtest results, the daily candles considers values until the current time(when you are viewing the scan), whereas when the alerts are sent, example at 10:05am, the daily candles contained data only until that time, so the results of the backtest graph will change thru the day in such a case. We have already added a note for the same, stating “Backtesting considers values as per completed candles of the timeframes, this may cause the results to change for the latest candle/time as its candle is being built.”

Backtesting considers the daily candles as of the current time, rather than when the alerts were actually run example at 10:05am or 12:50pm, so the results may not match with what you see in the backtest history along with your alerts history due to the above mentioned scenario.

If you want to show the same results in the backtest, you should have similar timeframes as per your alert eg: 5 minutes instead of “latest close” in the scan, this will ensure the backtest runs with the data of the 5 minutes timeframe, which will not change for completed cnadles i.e 9:15am, 9:20am and so on.. so that the backtest can then consider the close of the 5 minutes and plot the rows accordingly.

There’s no way to have this implemented in the backtest as well in the alerts, the reason being, if you view the chart for RSI on a daily timeframe for yesterday’s candle, it show’s the value as of 3:30pm, but actually the RSI on a daily candle at 9:15am for example would differ when compared with the RSI of at 10am or 11am or 3:30pm, but the charts only show yesterday’s RSI considering the daily completed candle i.e as of 3:30pm.

The same is being applicable for “close” or the “ltp” as well, which changes for a daily candle thru the day, so the results of the current completed candle can change, similar to the results that you view in the scanner at different times during the day

We have already added a note implying the same, that the current candle’s results can change(the same is true for any candletsick chart) as well, as the indicator values are as of the latest completed candle time.