Standard deviation and On Balance Volume(OBV) indicators are now added to our scanner.
Author: Akash
Backtest is now available!
The backtesting feature enables you to validate your stock against historical data, ultimately improving the accuracy used in the scan.
How to verify the stocks in the backtest?
- We offer a “Backtest Results” option for all scans, which is located below the scan conditions (pink button).
- This feature enables you to view the backtest bars, where you can select a specific date and time to see how many stocks fulfilled the scan conditions at that point in time.
- Upon clicking on the bars, you can access the stock names (SYMBOLS) and click on them to redirect to the charts.
- Here I have attached an image below & a video tutorial on this for reference – Verify backtest
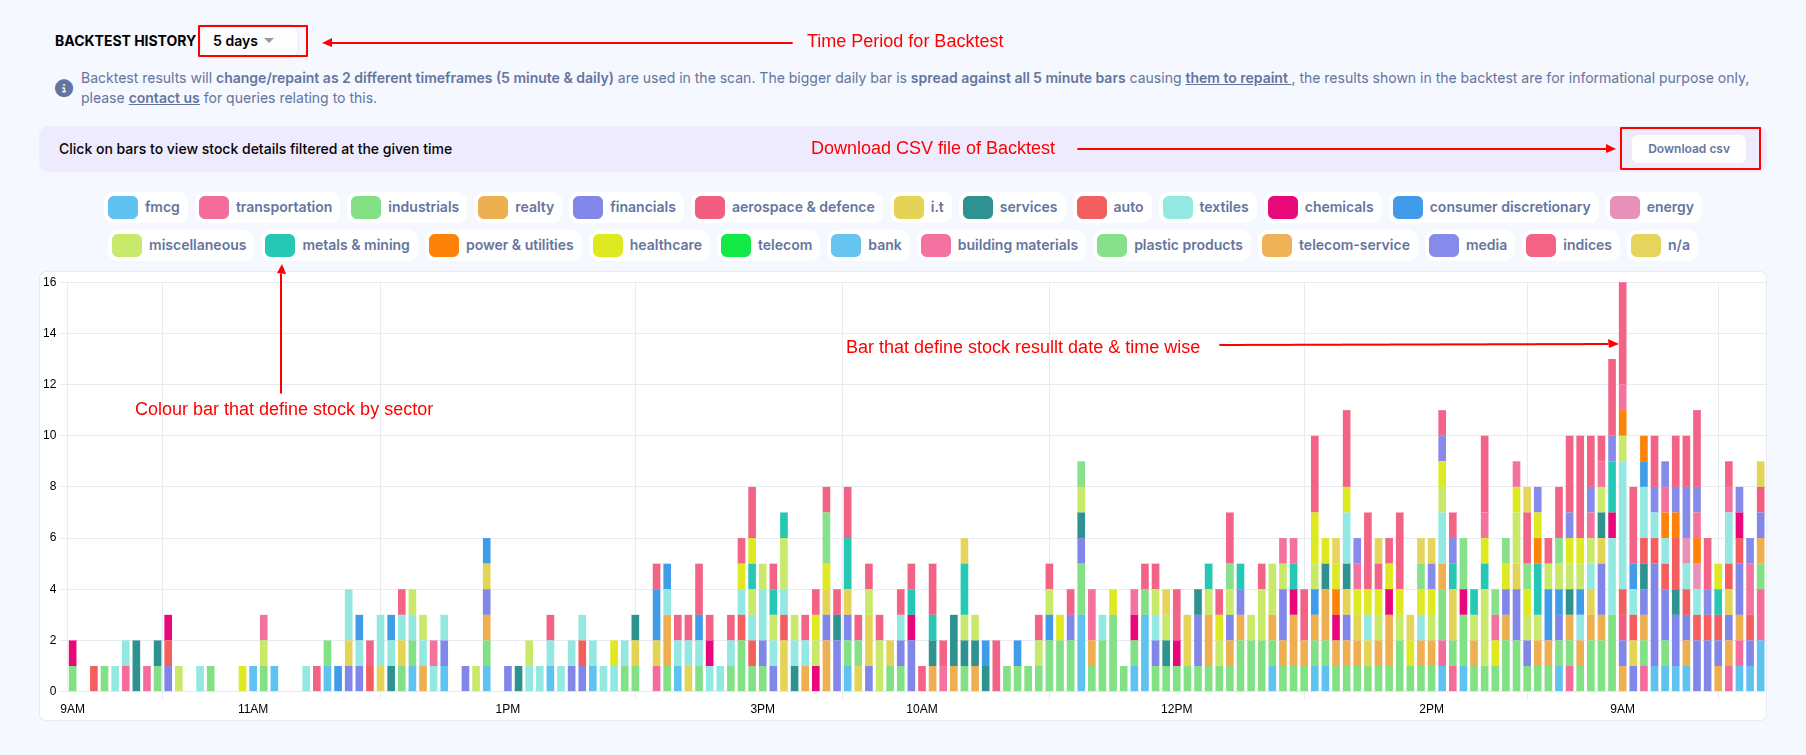
What is the backtest history limit for different timeframes for scans?
The backtest bars are always based on the smallest time frame you choose in the scan. Below, I’ve included a list of scan timeframes with the corresponding maximum backtest period –
- 5 minutes – 3 Weeks
- 15 minutes – 4 months
- 30 minutes – 8 months
- 1 hour – 1 year & 4 months
- Daily – 9 years.
Note – Backtest is limited to the first option only from the dropdown(Backtest history limit).

Do Backtest results keep updating/repainting?
Assuming the scan is made of different types of timeframe conditions, shown below –
- 5-minute close greater than the previous 5-minute close
- The latest RSI is greater than 70. For example, RSI greater than 70.
In this type of condition, you may ignore the backtest results as they may not always be accurate due to multiple time frame candles used in the scan(5-minute and daily candles). Backtest results use a higher timeframe(daily) candle that would spread for all bars within the backtest history. As long as the higher timeframe candle is incomplete, all bars in the backtest would also change/update, leading to potential inaccuracies.
In contrast, the alerts you receive for this scan are accurate and sent instantly once any stock matches all scan criteria.
Why do the Volume conditions affect my backtest results?
When using volume as a condition in the scans, it’s possible that some stocks may not immediately appear in the results when verifying with backtests. This is because the volume condition takes time to fulfil.
For example, if we have a scan with two conditions, such as a “15-minute RSI crossed above 60 and daily volume above 1 Lakh“, let’s say the ABC stock fulfils the RSI condition at 9:30 AM, but the volume condition is not yet met at that time. Due to this, the stock ABC will not show in the backtest.
However, if ABC meets all conditions later in the day (e.g., at 11 AM), the backtest will reflect the ABC stock in the backtest at 9:30 AM. So, if you want to avoid this behaviour, you can disable the volume condition.
Backtest results timing not matching alerts?
I assume you were comparing the backtest result time with the alert time. Note that the backtest will show the candle start time, whereas the alert you received is on the completed candle when a stock matches all the criteria.
To explain it in more detail, if you have a scanner for a condition such as “1-hour RSI greater than 60” and received an alert at 09:45 AM (assuming an alert time interval of 5 minutes), the backtest result will show 09:15 AM, which starts the time of the 1-hour candle. Hence, the backtest always shows the start time of that candle, whereas the alert you received is on the completed candle.
How to match backtest results with alert timing?
To ensure that the backtest results match the scan results, we recommend using the same time frame candles in the scan. For example – MACD Line crossing to MACD Signal in 15 minutes
Note, If you are using a 15-minute timeframe in your scan, then you should set your alert time interval to 15 minutes as well. This will ensure that you receive alerts based on completed 15-minute candles that satisfy the scan criteria.
Stocks showing in the backtest, but did not get an alert for it?
Assuming the scan has different time frames like “Daily, Weekly and Monthly”, for example, NKS BEST BUY STOCKS FOR INTRADAY
The reason for the discrepancy in the backtest results is that the scan is using the weekly and monthly timeframes, and when we are running the scan between the week/month. As a result, the scan is showing results based on an incomplete weekly/monthly candle. This causes the results in the backtest to continue to repaint/updated until the weekly and monthly candle completes its formation.
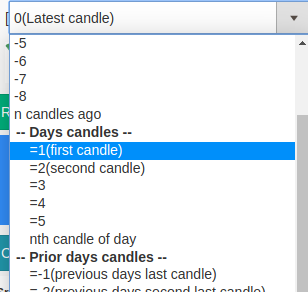
Filter stocks using 1st/2nd.. or any candle in our scanner
We’ve added the ability to access any candle of the latest trading day or previous days for Intraday timeframes. Useful for scans that require to access indicator values at a given point in time.
Example offset’s to access different candles for a trading day (5 minute chart)
- [0] 5 minute close -> refers to the latest 5 minute candle
- [=1] 5 minute close -> refers to the days’ first 5 minute candle
- [=3] 5 minute close -> refers to the days’ third 5 minute candle
- [=-1] 5 minute close -> refers to the previous day’s last 5 minute candle
- [=-75] 5 minute close -> refers to the previous day’s first 5 minute candle, considering a single day has 75, 5 minute candles
If you want to access the first candle on a 5 minute timeframe(9:15-9:19:59am), you can select your required indicator/stock attribute and then change the offset to `=1` as indicated below:
Crossover Support
Days candles also support crossover/below operations. For example, to identify a crossover at the opening candle, we can do “[0] 5 minute Close Crossed above [=1] 5 minute SuperTrend(7,3)”
Example scans
- 3 White soliders – 15 minute
- Open range breakout – 5 minute
- Market opening supertrend crossover – 5 minute
Desktop/Mobile (a.k.a Web) notifications
We are happy to launch Desktop & mobile notifications for Alerts; they allow you to receive alert notifications across multiple devices (mobile/desktop) that have a modern browser installed (for example, Google Chrome/Firefox).
Please follow the below simple steps to enable these notifications:
FOR DESKTOP NOTIFICATIONS
STEP 1: Visit our site, chartink.com on your desktop/laptop.
STEP 2. a: You will be prompted with a message as below; click “Allow Alerts” to proceed. If the prompt is not visible, perform the next step (step 3).
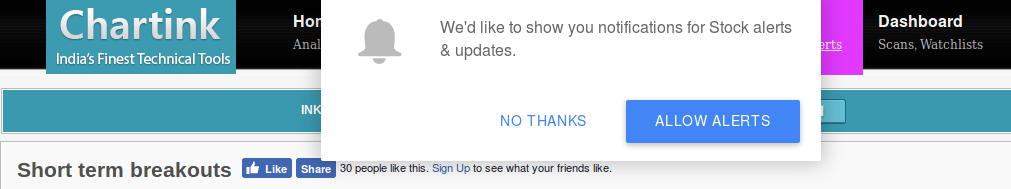
STEP 2. b: Skip this step if you are able to see the above prompt. If not, search for the “Bell” icon at the bottom right of our site & click on it to “Subscribe” for notifications![]()
STEP 3: Click “Allow” to enable notifications for our site: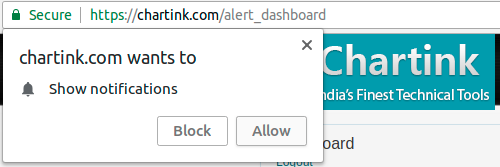
STEP 4: Finally, visit the demo-notification page; you should receive a desktop notification; these notifications are enabled for all your activated alerts
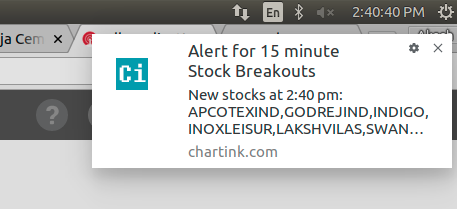
Sample notification
Sit back and relax, we’ll show a pop-up(alert) on your computer screen once we notice new stocks are available in your screener.
If you face any issues, kindly review our troubleshooting guide or directly reach out to us at [email protected]
FOR MOBILE NOTIFICATIONS
Follow the below video tutorial to enable web push notifications on mobile. Note web push notifications on mobile are supported only by Andriod devices
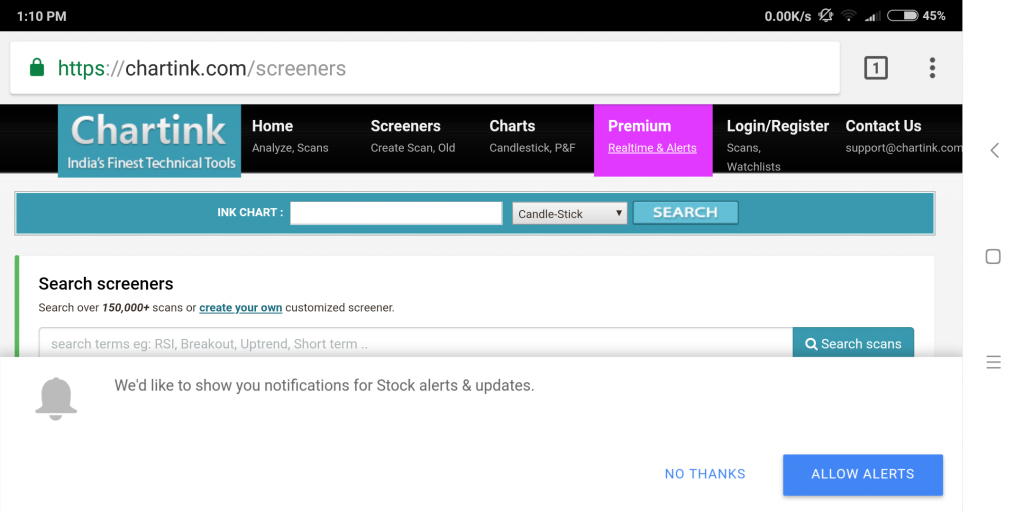
STEP 1: Visit our site, chartink.com, on your mobile device.
STEP 2. a: You will be prompted with a message as below; click “Allow Alerts” to proceed.
 STEP 2. b(optional): Skip this step if you are able to see the above prompt. If not, search for the “Bell” icon at the bottom right of our site & click on it to “Subscribe” for notifications.
![]()
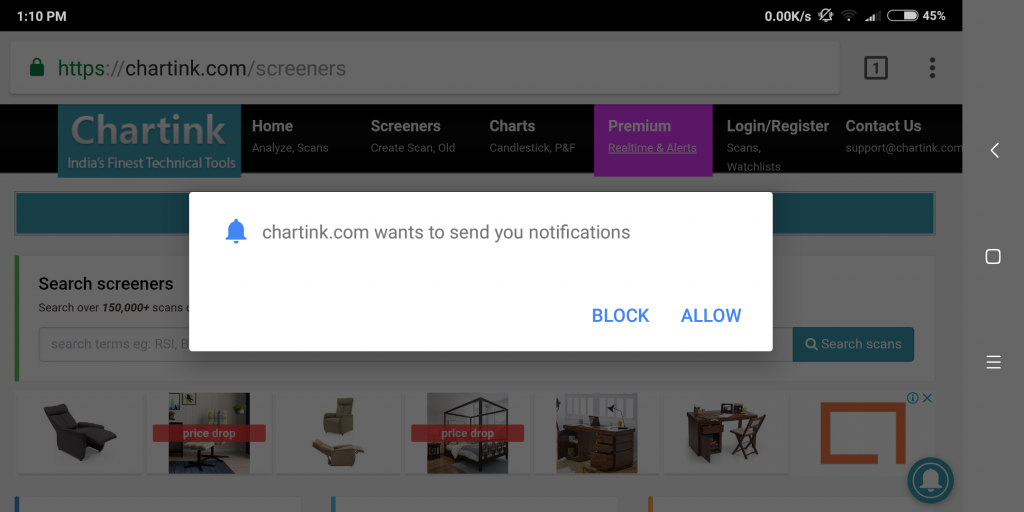
STEP 3: Click “Allow” to enable notifications for our site
STEP 4: Finally, visit the demo-notification page; you should receive a mobile notification. These notifications are enabled for all your activated alerts
If you face any issues, kindly review our troubleshooting guide or directly reach out to us at [email protected]
Square & Square root function added
Square & Square root functions are now avaliable for Gann screeners

VWAP – Volume weighted average price is now available in our scans
VWAP – Volume weighted average price is now available in our scans across all timeframes, here’s a example using the stock attribute: https://chartink.com/screener/close-above-vwap across all timeframes
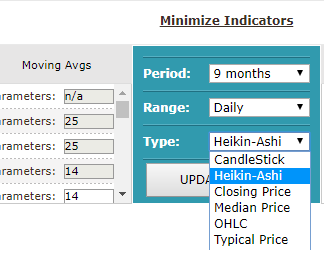
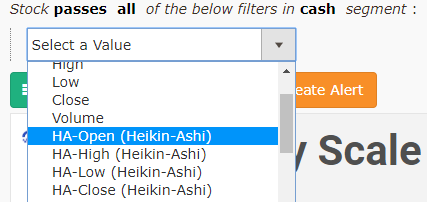
Heikin-Ashi Candlesticks Scans & Charts are now available!
Alerts Guide
Alerts is a premium feature on chartink.com that allows users to receive notifications when stocks matching their specified criteria are identified by our screeners. These notifications can be delivered via Desktop/mobile web, SMS, or email and are continuously monitored to ensure that users are promptly notified of any new matches. In this guide, we will walk you through the process of setting up and managing alerts on our platform.
CREATING & MANAGING ALERT
For any screener you want to create an alert for, click the “Create Alert” button (right beside save as). If you’re still looking for good screeners, we suggest you start with our top-loved scans, which contain a good mix of intraday/swing and short-term scans.
Alert settings :
Please find below a thorough explanation of the alert box functionality:
Alert setting box
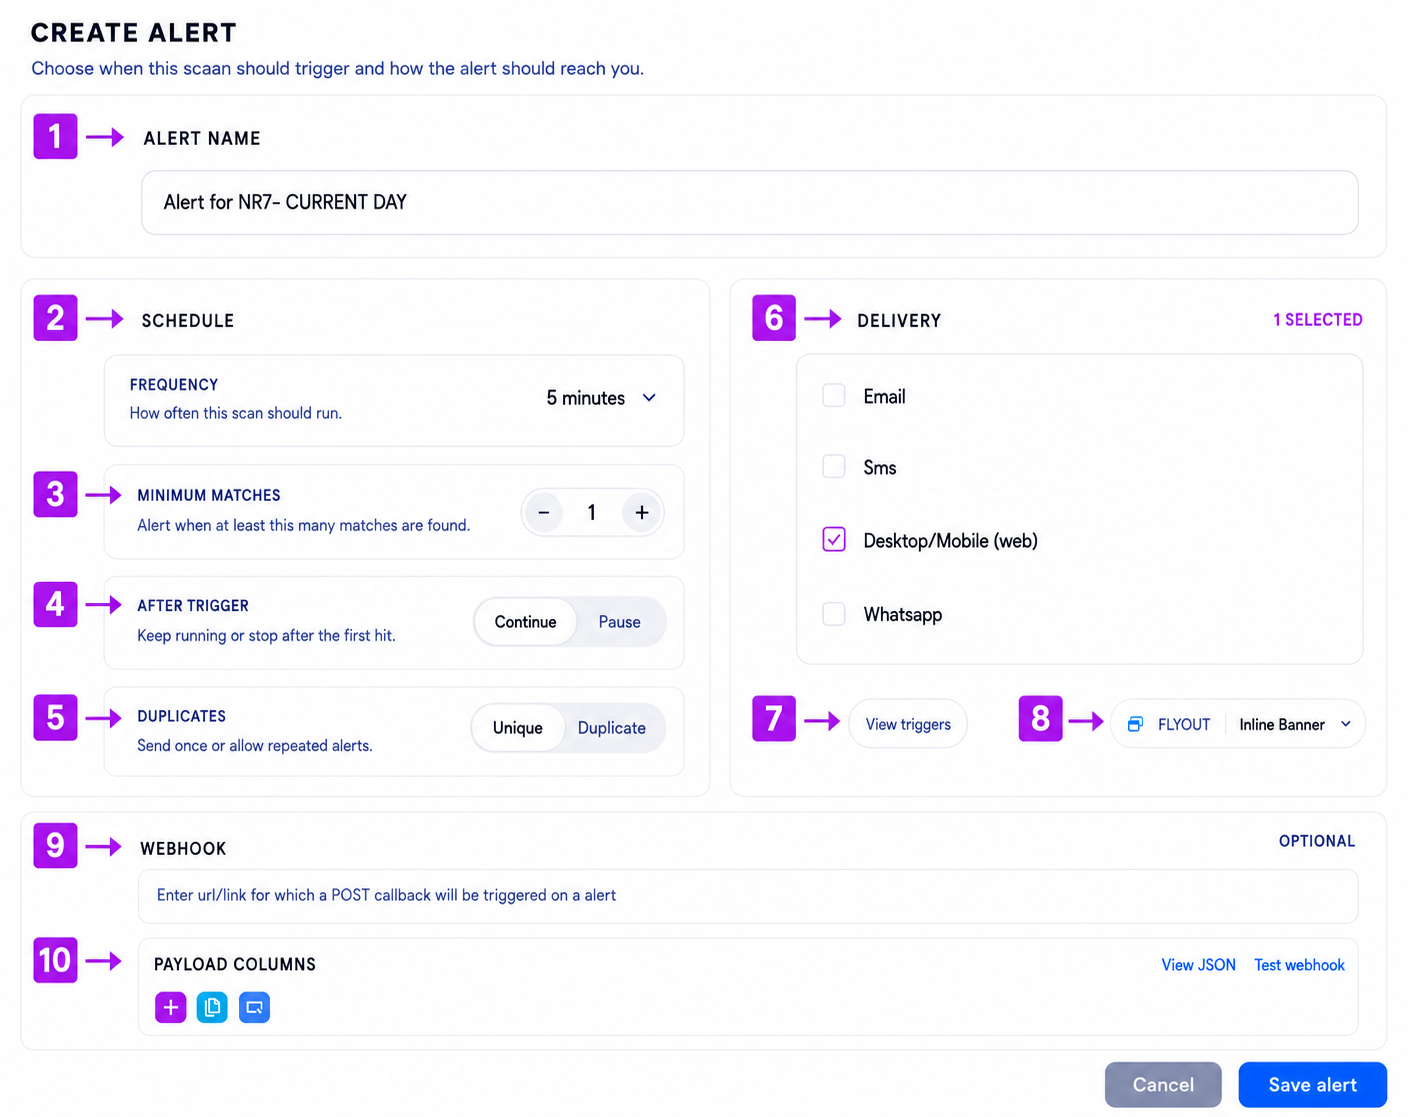
1) Alert Name –
Here, you can enter a custom name for your alert. This helps you easily identify and manage different alerts later. You may also use the same name as your scan if preferred.
2) Schedule / Frequency
The frequency option allows you to decide how often the alert scan should run.
You can configure alerts to trigger at intervals such as every:
- 1 / 2 / 3 / 5 / 10 / 15 / 20 / 30 / 60 / 120 / 240 minutes
- Market Open
- Market Close
For more information on the frequency of alert execution, please refer to our FAQ.
3) Minimum stocks to alerts
This option allows you to set the minimum number of stocks/results that must match the scan conditions before an alert is triggered.
For example:
- If the Minimum Matches value is set to 5, the alert will only trigger when at least 5 stocks satisfy the scan conditions.
- If only 2 or 3 stocks match, no alert will be sent.
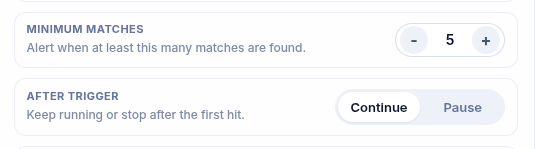
4) After Trigger –
This setting determines what should happen after the alert condition is triggered.
- Continue – The alert will continue monitoring and triggering whenever conditions are met again.
- Pause – The alert will stop automatically after the first successful trigger.
5) Duplicates (Unique / Duplicate Notifications)
Unique
With the Unique option enabled, you will receive only one alert per stock for the day, even if the stock matches the scan conditions multiple times.
Example: If a stock triggers the alert at 9:30 AM and again at 1:00 PM, you will receive only the first notification.
Duplicate
The Duplicate option allows repeated notifications for the same stock whenever it matches the scan conditions again during the day.
6) Delivery / Notification Methods
This section allows you to choose how you want to receive alert notifications.
Available notification methods include:
- SMS
- Desktop/Mobile (Web) Notifications
- WhatsApp Notifications
You can select one or multiple delivery methods as per your preference.
7) View Triggers
The “View Triggers” option allows you to see which stocks or scan conditions have already triggered the alert.
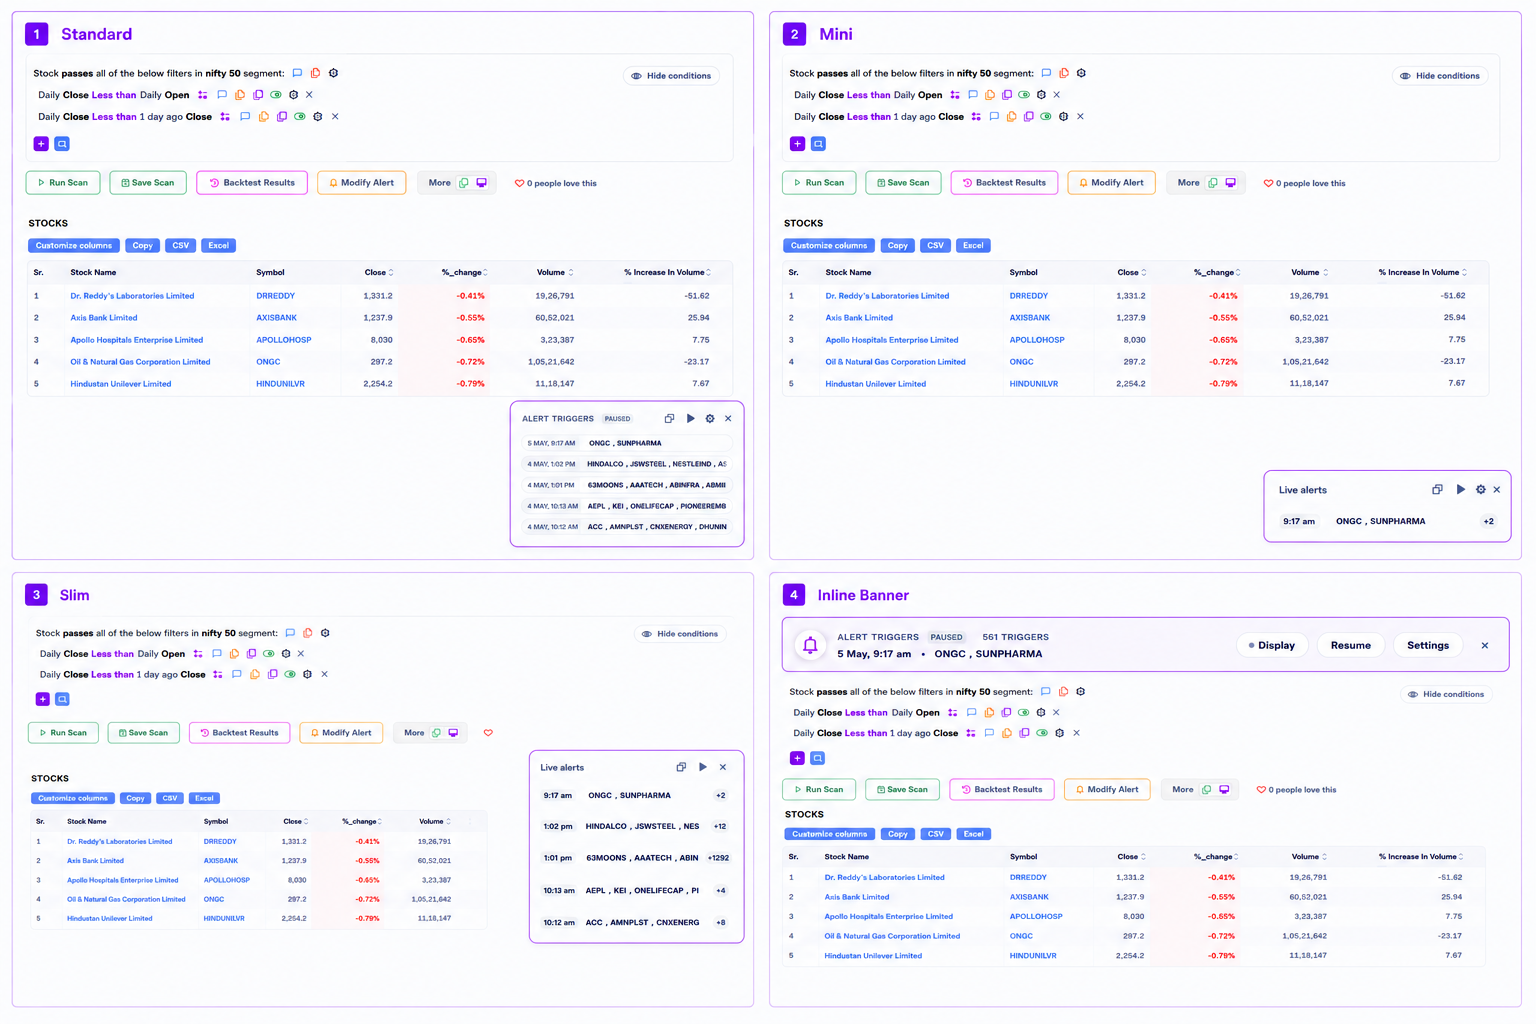
8) Alert Display Type (Flyout / Inline Banner)
This option allows you to choose how alert notifications should appear on the screen.
- Flyout – Displays alerts as popup-style notifications.
- Inline Banner – Displays alerts within the platform interface as a banner.
9) Webhooks
The webhook feature allows alerts to automatically send data or messages to external applications whenever an alert is triggered.
When activated, the system sends an HTTP POST request to the provided webhook URL.
This enables automated communication between platforms and can be used for:
- Algo trading
- Third-party integrations
- Automation tools
- Custom workflows
10) Payload Columns
Payload Columns allow you to customize which stock data fields should be included in the webhook response or alert payload.
For example, you can include:
- Stock Name
- LTP
- Volume
- Indicator Values
Viewing alerts –
All alerts created can be viewed on the Alerts Dashboard.
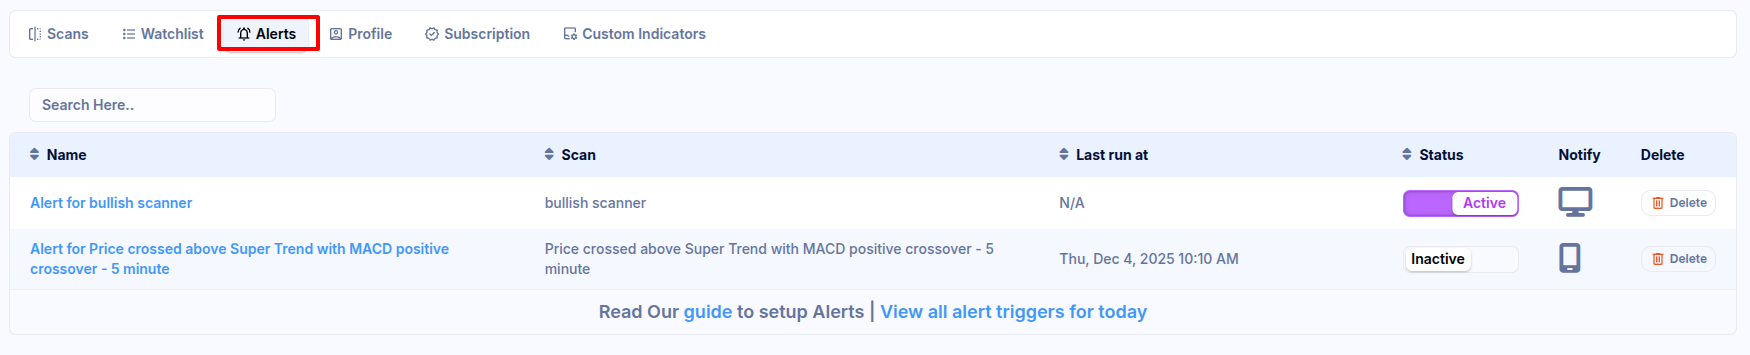
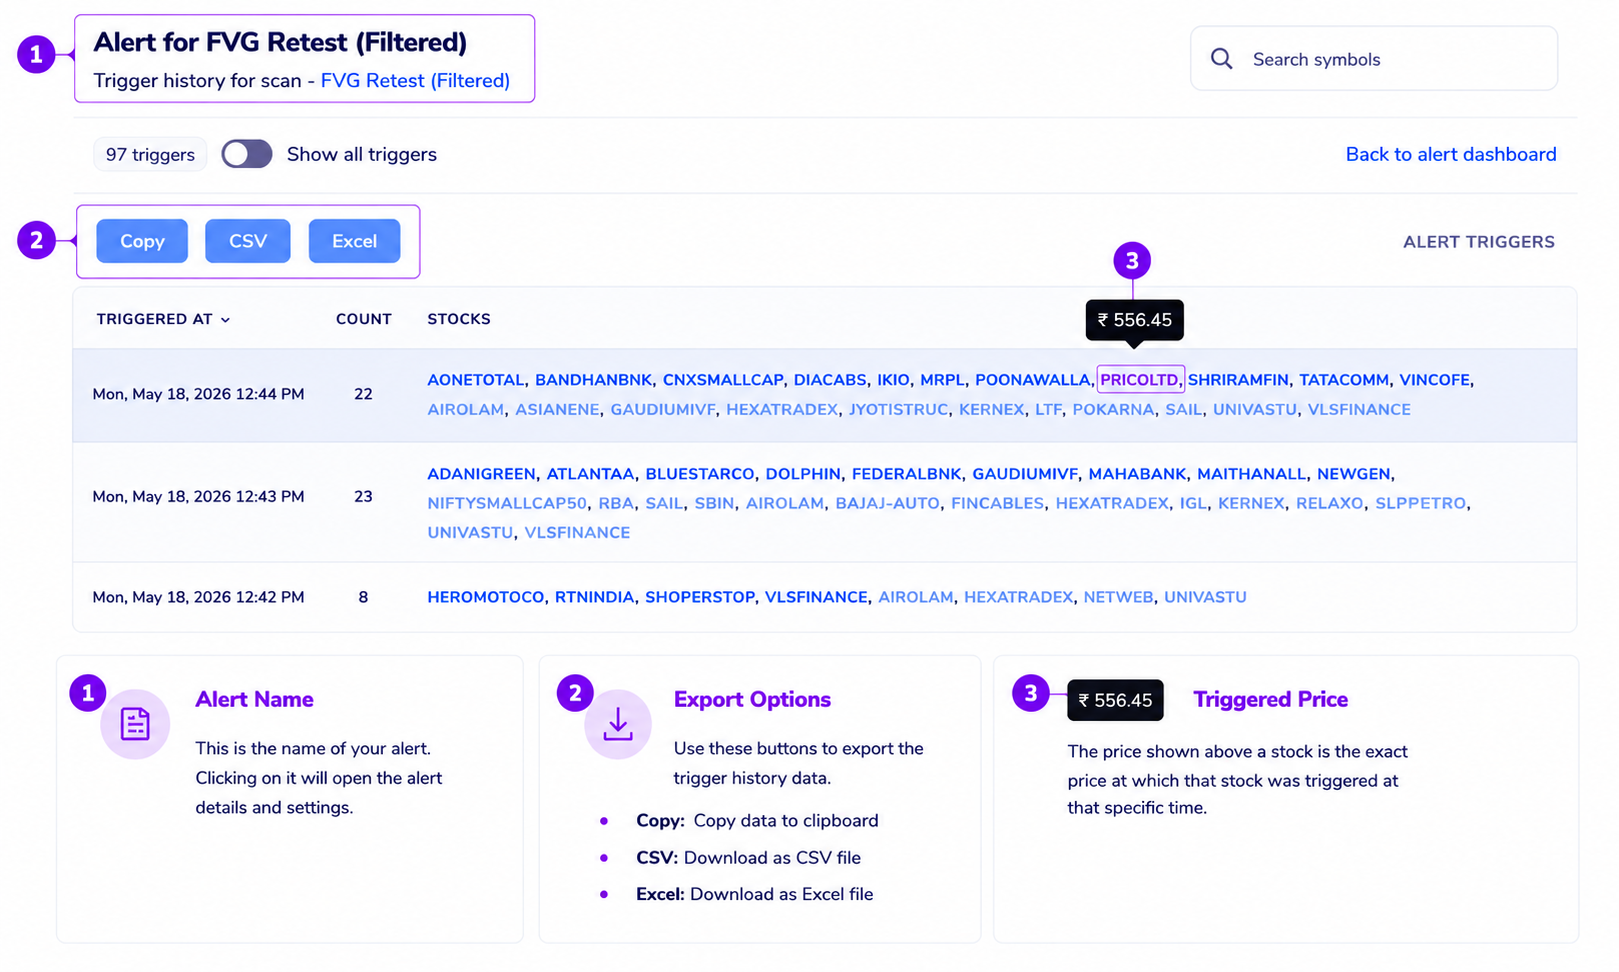
Alert Triggers/HISTORY –
A trigger lets you know when alerts for screeners have been triggered, and new stocks have been filtered. You will receive alerts via email or SMS when notifications have been sent. You can access the alert triggers page by clicking any alerts on the Alerts Dashboard.
Frequently asked questions
Kindly refer to our FAQs for alerts here.
Feel free to reach us at [email protected] for any doubts.
Alerts FAQ
How to create alerts?
We’ve created a step-by-step guide on how to create alerts across any screener.
How many stocks are scanned for alerts?
We default to running scans for all NSE stocks unless you change a scan to run for a watchlist, nifty 50, nifty 100. The number of stocks scanned for is dependent on the scan definition.
When are intraday, daily, weekly and monthly alerts run?
-
- Intraday – An alert for 1 minute starts running at 9:16am(Lowest time interval). Considering the latest data as of 9:15:59am, the next run would be at 9:17am.
- Market open – Runs at 9:20am considering the latest data as of 9:19:59am.
- Market close – Runs between 6pm-7pm daily
- Weekly – Runs every Friday between 6pm-7pm
- Monthly – Runs on the last day of the month between 6pm-7pm
Are the alerts live[in real-time]?
Yes, our scans run on the latest live data available eg. If you have configured to run a scan every 5 minutes, the first scan would be at 9:20am, which will be based on the data as of 9:19:59am. As we process dozens of scans for every user throughout the day, there could be a delay of up to 1 minute while you are notified.
How frequently would I be notified of alerts?
We send our alert notifications based on alert configuration. If you’ve set an alert to run every 5 minutes, it shall run at 9:20am, 09:25am, and 09:30am. We send you notifications ONLY when we find new stocks the scans to avoid spamming your SMS/mailbox.
How many alerts I shall receive?
We provide a total of 2,000 SMS & email credits in a month, which are used while sending alerts. These allow you to receive more than 90+ alerts per day. Notification credits(SMS & email) will be used at an alert level and independent of the number of stocks filtered in a scan. If an alert notifies you about 50 stocks, it will use a single notification credit.
What happens when your NOTIFICATION credits finish?
You can purchase additional SMS or Email credits. Visit your subscription dashboard to do so.
HOW DO WE SEE ALL THE ALERTS CONFIGURED?
We provide a alerts dashboard that allows you to configure and manage your active alerts.
Do you provide the scanners, or does the subscriber have to use his own scanners?
You can add alerts on any of the 1,50,000+ screeners‘ available on the site or create your own.
IS THERE FREE TRIAL AVAILABLE?
We provide all our other tools(scans, charts) free to use on our site. Alerts are resource intensive and is also supported by external services, including sms/email, which include additional costs’. Hence, we don’t provide a trial for the same.
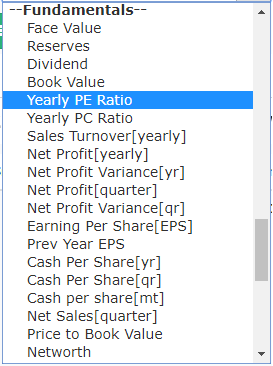
Fundamental filters now avaliable!
Scans can now be created using a mix of Fundamental & Technical indicators. Fundamental parameters in scan can be validated against our fundamental page.
Example fundamental scans can be found here. We have the following list of fundamental indicators as of now:
Results for Consolidated figures in Rs. Cr.
-
- Face Value
- Reserves
- Dividend
- Book Value
- Yearly PE Ratio
- Yearly PC Ratio
- Sales Turnover[yearly]
- Net Profit[yearly]
- Net Profit Variance[yr]
- Net Profit[quarter]
- Net Profit Variance[qr]
- Earning Per Share[EPS]
- Prev Year EPS
- Cash Per Share[yr]
- Cash Per Share[qr]
- Cash per share[mt]
- Net Sales[quarter]
- Price to Book Value
- Networth
- BSE Value in lakhs
- NSE Value in lakhs
- Market Cap
- Operating profit margin[yr]
- Operating profit margin[qr]
- Gross profit margin
- Gross Block
- Total Loans
- Advance Given By Bank
- Net non performing assets
- TTM – Trailing 12 months Sales
- TTM – Trailing 12 months Operating Profit
- TTM – Trailing 12 months Operating Profit margin
- TTM – Trailing 12 months Gross profit
- TTM – Trailing 12 months Gross profit margin
- TTM – Trailing 12 months Net profit
- TTM – Trailing 12 months Net profit Variance
- TTM – Trailing 12 months EPS
- TTM – Trailing 12 months PE
- TTM – Trailing 12 months CPS
- TTM – Trailing 12 months Depreciation
Fundamental parameters can be added on create scan page after clicking the filter icon