The enclosed information will help you develop the skills and knowledge to create, understand, and run custom scans for technical & fundamental indicators. While reading this guide, we suggest having our scanning tool open in another window to apply the demonstrated steps, which would help you create your unique custom scans.
New! Video Tutorials
More video tutorials by “Fun Techni.”
More video tutorials by “Samco Securities.”
Introduction-
Chartink scanner offers unparalleled flexibility to deliver custom, accurate, and fast stock scans. Chartink’s scanner is a powerful tool that enables you to scan stocks based on the technical levels and indicators you have developed through your experience with stock markets and technical analysis. Some examples of what you can do with the scanner include listing stocks that have crossed the 200-day moving average, have RSI values greater than 70, or have the Highest volume, and many more.
The scanner allows you to customize technical (e.g., RSI, MACD, breakout..) and fundamental parameters (e.g., P/E, book value..) to suit your needs.
Filter components

A scan comprises several filters, which can be added by clicking on the filter icon![]() .
.
A scan with a single filter appears as follows:
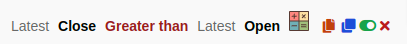
The scan, besides filters stocks whose “close is greater than 500”, notice the interface relates closely to our English language grammar –
Stock attributes

Relates to the open, high, low, close, and volume are always prefixed by an offset that indicates whether you are looking for the current candle Value, a value of the previous candle, or a specific number of candles ago, applies to all timeframes, such as daily, Intraday, weekly, monthly.
Steps performed to add “Close” as a filter attribute. Notice the “Offset” component automatically added.
Offsets

Relate to the timeframe for the indicator for the current or prior candle; often, you’d want to compare the values of a specific component from one day to another, like, referring to the RSI value of today & comparing it against the RSI value 10 days ago.
Offsets allow you to add this flexibility to your analysis, enabling you to compare components from days before the most recent trading day. This can be useful when conducting trend analysis or identifying potential opportunities in the market.
For example, you may want to identify stocks that have closed above their previous day’s close.
Hint: An offset is automatically added once you select a stock attribute or an indicator defaulting to “Latest” (current daily candle). To change, click on it(latest).
Number constant:

Hard-coded numbers are fixed/constant values. To create filter, you can use comparison operators (like greater than or less than) or math operations (+,-,/,** *) to create a filter.
Indicators:

You can add multiple indicators, such as SMA, RSI, MACD, and ADX, and perform various computations on them to filter stocks.
Most indicators require a parameter for their computations, and Chartink automatically sets a default value for the parameter when you add the indicator (shown in brackets).
You can easily change any indicator’s parameter(clicking on it) to suit your needs.
Adding SMA as an indicator(to the first line), notice the parameter for SMA i.e (close, 20), signifying the computations to be on the “close” stock attribute for the past 20 days.
Hint: If an “Indicator” requires multiple parameters, they are separated by a comma, e.g., “(close, 20)” here.
Operations:
After adding a “stock attribute” or “indicator”, you may want to perform operations on them to compare them or use them in your custom criteria. These operations allow you to link indicators and other filter components together to create more complex criteria. For example, you may want to compare an indicator value to a number constant or add two indicators together.
The format for linking operations with other filter components is as follows:
indicator operation(greater than/less than) number constant ....
stock attribute operation(equals) indicator ....
number constant operation(*, /, +, -) number constant operation(less than) indicator ...
An operation can be performed by clicking on the icon. “Also, multiple operations can be performed for a single filter.
Types of operations:
Arithmetic:
To construct more advanced scans, you can use arithmetic operations (add, subtract, multiply, divide) on filter components. This allows you to create scans for stocks that have gained a certain percentage today (e.g., 5%). The example below shows a scan that uses two operations, one of which is an arithmetic operation (*), to filter stocks that have experienced a gap up or gap down. Here is an example scan.

Comparison:
Probably the most common operation you’d use, as every valid scan requires a comparison among 2 filter components. A single filter can have only a single comparison. In the below snippet, the “greater than” operation denotes the relation between the 2 stock attributes(close & open) & filters stocks that have a “Close” greater than a stock’s “Open.”; here is an example scan.
Crossovers:
Often you’d want to filter stocks based on certain breakouts, which can occur when a stock closes below a certain value yesterday but closes above it today (signifying a crossover). [Value here refers to any indicator or stock attribute.] here is an example scan.

The above would filter Stocks that closed below the 20- day SMA yesterday but today it closed above the 20-day SMA (crossing over from below).
Steps to add operations to a stock attribute:
To filter stocks that are closing above 5,000, you can perform the following operation:

Steps to create the scan
- Select the ‘Add a filter’ option from the menu.
- Choose the ‘Close’ attribute from the list of available stock attributes.
- Select the ‘Greater than’ comparison operation.
- Enter the Value of 5,000 in the constant number field.
Multiple Filters & Filter Behavior:
Normally you’d want to have multiple filters specified in a single scan. To add more than a single filter again, click on the filter icon and select a new filter to add.
i.e., You can change the filter’s behavior within a scan to achieve an AND or an ANY condition or even have it fail a certain filter within your scan.
Sub-filters/Grouped filter:
Sometimes it may be necessary to group filters and their behavior to create more complex criteria.

In this scenario, we can see that the main group condition passing is “latest close > 200”. This condition is a must. 2 sub-filters or sub-groups are created after that, out of which the scan passes any 1 of the 2 groups along with the main condition “latest close > 200”. You can see the sub-groups are highlighted and are being passed in a “Passes Any” join.
Scan for EMA 20 with volume OR close crossing EMA 20 where RSI above 70
Functional Filters(Min/Max):
The Min and Max filter components are unique because they accept other filter components as parameters. These functions are useful for calculating the highest or minimum values over a specified number of days. These functions take two parameters, as follows:
- Period – Denotes the periods over which this function shall perform its computations.
- Measure(stock attribute, indicator) – Denotes the measure against which the computation shall be performed.

To identify stocks that have reached their 52-week High on a given day, the Max(period, measure) function can be used.
After selecting this function, its required parameters will be automatically added. These parameters can be modified by clicking on them; in this case, they should be changed to 252 and High.
The measure selected, in this case, High is used to identify stocks at their 52-week High, which consists of 252 trading days.
This allows for identifying stocks that have reached this milestone on the specified day(latest).
Examples with scans –
We’ve compiled a few examples to help you design your custom scans. Click here to view more example scans. You can also browse through the scans created by other users here.
Overbought filter:
List stocks that have RSI(14 days) changed their zone from below 70 yesterday to above 70 today, indicating they are likely to see entering to overbought zone. Here is an example scan.

Oversold filter:
List stocks that have RSI(14 days) changed their zone from above 30 yesterday to below 30 today, indicating they are likely to see entering the oversold zone. Here is an example scan.

Gap-up filter:
Listing stocks with an open greater than 3% of yesterday’s close. If a stock closed at 100 INR yesterday, Its open today should be greater than 103, denoted by “1 day ago Close * 1.03”. Here is an example scan.
![]()
Gap-down filter:
Listing stocks with an open of less than 3% of yesterday’s close. If a stock closed at 100 INR yesterday, Its open today and should be less than 97, denoted by “1 day ago Close * 0.97”. Here is an example scan.
 stocks")
Bullish stocks filter:
Often a crossover of 50-day SMA over 200-day SMA is treated as a bullish signal. Here is an example scan.

FUNDAMENTAL SCANS
Examples and usage of fundamental filters can be found here.
Frequently Asked Questions –
Kindly refer to our FAQ page for further queries. If you have any suggestions/doubts, kindly contact us.
We hope that this guide provides a solid foundation for creating custom scans and helps you make informed trading decisions.
chart ink, require to provide data brake up, like 25 min chart etc
Sir I want ur 25 min data pls contact me at 9510964013
sir please install trand line’s in you’s chartink chart , it will help’s to stocks trand , you should update or install ”trand line ” and also HH AND LL AND HL AND LH ,IN YOU CHART INK THx
Did you mean Trend lines? Also can you give more details on what are you looking for(HH, LL)?
High high and Low Low
Below is an example scan for the same:
https://chartink.com/screener/5-day-higher-high-breakout
Low
When can I get latest screeners before market opens,if I enrol as a paid member.
Stocks making higher highs and LOWER LOWS should be added. similarly higher lows and lower highs need to be added.. also you should add stocks nearing trend line supports and resistances on daily ,weekly , hourly and 15 minutes charts. Also need to know breakouts on trend lines.
We have many scans for this, here’s one on a daily candle: https://chartink.com/screener/5-day-higher-high-breakout
Hi Akash ,Happy to know you are there,I communicated with you about 4, 5 years back.God bless you.
🙂 Hope you doing good. God bless you too..
Hello Akashji, can v talk , not understanding how to set one scanner, pl drop your no on 9769951451 , wl call you
Jitesh M
Mumbai
hello akash
i want to know how to check some condition
for example if my latest candle closes below vwap i want to check if it has macd or sma crossover in the past 15 min anytime in past 15 min . please help
Hello,
Sure, below is an example scan for the same:
https://chartink.com/screener/current-close-crosses-below-vwap-and-previous-candle-either-below-sma-20-or-macd
Hi Akash, could you plz update ‘ZigZag’ for the scanner in order to scan waves (eg., HH, LL) on smaller time frame like 5min, 15min? Or else if there is any other way to scan HH, LL on 5min chart?
Happy for the great effort made so far. The toll is amazing!
Hello,
There are a few scans on the same created by members on Zigzag. You may view them here: https://chartink.com/screeners/search?search_term=ZigZag
trendlyne.com
I want to register with yo0u
As a premium member you would be able to:
Access realtime data for Charts & Scans every minute
Create Alerts and receive updates of stock breakouts over sms/email/mobile/desktop
View charts in 1/2/3 minute timeframes with auto-refresh
Run screeners in 1/2/3 minute timeframes with auto-refresh
Scan any watchlist via the segment dropdown of a scan
Get Dedicated support for your scanner requirements
You can get details/signup our premium service here: https://chartink.com/subscription
Sir today I paid one month subscription fee but can’t understand how to create the filter any can help me my mobile 9903169001
If you need help in creating a scan, please share your requirements and we shall caret the same for you. (email at [email protected])
You may view tutorials on scans and alerts here:
https://chartink.com/articles/scanner/scanner-user-guide/
https://chartink.com/articles/alerts/alerts-guide/
You can also start by reviewing out top scans here: https://chartink.com/screeners/top-loved-screeners
They contain the top 10 scans used for Intraday/Swing & short term trading
is there any open intrest build up scanner for 15 min..
Currently we support only NSE cash stocks and indices. We do plan on adding others in the future. Shall keep you posted.
SIR I WANT CPR NARROW RANGE STOCK PLEASE GUIDE HOW TO SCAN MY EMAIL ID [email protected]
Below is an example scan for the same:
https://chartink.com/screener/nr7-612
Is it possible to create a custom scan and have it auto-refreshed every 15min or 1hr?
Hello,
Currently, auto-refresh is for every 1minute. We can’t change the auto-refresh time.
Want 5 20 ema crossover 5 min time frame
Hello,
Here is your scan for the same. Kindly review:
https://chartink.com/screener/ema-5-crossing-above-ema-20-5-minute-timeframe
how do I set it in mobile
Hello,
We do not have a mobile app (Android or IOS). This is only a web-based application. However, you can access Chartink on your mobile phone via the web browser.
If you are referring to setting up scan or alert in mobile. Below is our YouTube channel. Kindly review.
https://www.youtube.com/@ChartinkConnect
I want to register with you
You can get details/signup our premium service here: https://chartink.com/subscription
I want to find the supertrend breakout for weekly and monthly candles like I do for 30 minutes or 1 hour or daily candles. How do I do it?
Sure, below is a scan for weekly crossover:
https://chartink.com/screener/weekly-close-crosses-above-supertrend
Kindly confirm Need to use “Crossed above” or “Greater than” as Operations. “Greater than” Operation works correct. “Crossed above” missed many stocks.
If you are comparing candles, you need to use greater than/ less than. If you are using it for indicators, then crossover function needs to be used.
Please provide offset parameter for EMA.
Thanks
You can directly plot it ahead of time. Eg: If you’d want to plot/scan with the EMA of a offset of 26 on today’s chart, you can directly do “26 days ago EMA(close,20) less than Latest close”, this ways’ the EMA 20 of 26 days ago, will be compared against the latest close of today
HOW TO GET ema without offset for example ema ( close,5 ) instead of ema(latest close,5 ). Thanks
Hello,
By default, it would always show the offset since we need to specify where to start calculating the EMA. Hence, the “latest” would always be present by default.
I want 20% below from 52week high, how I get stocks,
Hello V P Singh,
Here is your required scanner; kindly review – https://chartink.com/screener/20-below-from-52-week-high-stocks
bulish and nest day
Absolutely marvellous exercise launched by Chartink …….I am regular user of Chartink EOD charts for a long period will absolute comfort…….though I have vaguely understood wht u had conveyed, I would request you to demonstrate each of the options given above by way of an example of real stocks…….that would really help in guiding us…….if u need more people to attend this tutorial online…..there are many many people in my group……pl guide as per yr requirement…..Thanks
Thanks for your feedback. We’ll be soon add video tutorials for better guidance of the scanner
Sir, please give money flow index overbought or oversold
This is same as RSI, you can refer this screener & change RSI to MFI, http://chartink.com/screener/weekly-rsi-overbought-oversold-scan
How this can be helpful to enter & exist from the stock
rsi can not change into MFI please add MFI option like others indicator added in your selector
We do have the MFI indicator. You can choose it from the drop down menu.
Respected sir,
I am a regular user of Chartink EOD charts. I visit daily for research and study stocks. According to me this is best website for investors and traders.
If I run a simple query like “Latest Close Greater than number 500”, nothing happens.
However, when all this starts working, it would be a fantastic tool.
One suggestion: Can you provide a facility to apply these filters to NIFTY stocks, JUNIOR NIFTY Stocks, CNX IT Stocks, etc?
Hello Team
Amazing website. I use it extensively for my research. Keep up the good work!
Dear chartink team !
Thanks a lot for new scanning tool.
My query: how to scan 3 candles at a time(p1, p2, p3) .
example: p2 close price is lower than p1 close price.
p3 close price is higher than p2 close price.
Thanks for your feedback.
I think your query is quite similar to one of our examples, http://chartink.com/articles/scanner/stocks-in-uptrend/
Let me know if that helps
Akash ji,
It works ! Thanks for your quick response.
(Latest Open less than 1 day ago open
1 day ago open less than 2 days ago open
Latest open greater than 1 day ago close
1 day ago open greater than 2 days ago close
latest close greater than 1 day ago close
1 day ago close less than 2 days ago close
latest close greater than 2 days ago close)
2nd query: How to apply this method on weekly & monthly chart for all data?
Currently we scan only on daily data, we plan on adding weekly/monthly data in the month of Feb
Okay akash ji,
Akash ji,
(( Latest Open less than 1 day ago open
1 day ago open less than 2 days ago open
Latest open greater than 1 day ago close
1 day ago open greater than 2 days ago close
latest close greater than 1 day ago close
1 day ago close less than 2 days ago close
latest close greater than 2 days ago close))
This method is working eod, But live it jumps p4 candle, how to resolve this problem ?
I would like to have this method live trade before 3.30 pm.
Hi Mr Akash,
Can you please help us with weekly and Monthly chart scanner?
Regards,
Rangaswamy
P1 is -2
P2 is -1
P3 is 0
-1 close less than -2 close
0 close greater than -1 close
Do you need this scan on daily candles?
hii sir i need your Help please tell me what can i do… i have to set a new scanner so plzz help me for set a EOD scanner,
condition 1 st….. 1st candle made Low, 2nd candle made Low But 3rd candle open and Low Above 1st candle Low minimum 0.05 paisa.
condition 2nd….. 1st candle made high, 2nd candle made high But 3rd candle open and high below 1st candle high minimum 0.05 paisa.
if you available for set this new scanner plzz contact me on my mail id [email protected]
Very good work chartink by providing scanner.. I would like to know is it possible to get sma 50 crossed above sma 200 before market close for the particular day? Because it ll be helpful to do profit book next day early morning
We’re working on integrating the scanner with market hour candles(15 minute delay), it shall be ready to use in the month of Feb’16
Thanks akash ji,
Finally solved my 4th candle jumping issue,
Exciting to wait weekly & monthly chart by chartink scanner!
what is the solution u get it i have the same query
Thank you so much for ur efforts..
Hi Mr Akash,
Can you please update on integrating the scanner with market hour candles as mentined by you above?
Regards,
Rangaswamy
Hi Akash ,I am not able to distingush which set is for bullish and which on for bearish can you pl help me ?https://chartink.com/screener/bullish-sar-ema-crossover-15min
In the first sub-filter where it checks for crossabove, would be to check for bullish stocks. Cross belows would be bearish.
how to scan for weekly chart or monthly chart??? nice work..
Can I scan only Future Stocks, please add 30min and hourly charts data.
IS ANY IMPROVEMENT TO FIND OUT ONLY FUTURE STOCKS
Hello,
You can select the “futures” as a segment in place of “cash” segment from the dropdown list.
Kindly note: Currently, we support only NSE cash stocks. We have only created a segment group called ‘futures’ to scan stocks that are traded in the F&O group. If you select futures, scanning will be done on basis of cash stock prices/ values.
Please add some more features for:
1. Analysis only on index graph not on index listed company for example: nifty 50 index graph not on nifty 50 company.
2. INDEX option chain data Example: first I will select index in which I want to trade then it’s Call /Put option strike and expiry date as well.
3. RSI Divergence in you indicator.
Hello,
Please find our responses to your queries below:
1. Can you please elaborate a bit more on what you are trying to achieve here exactly?
2. We currently support only NSE cash stocks and indices; we have created a segment group named ‘futures’ to scan stocks traded in the F&O group. If you select futures, scanning will be done based on cash stock prices/ values.
3. Do you mean you want a scan to show RSI divergence? Kindly confirm.
Thanx Charting for a valuable software.God always bless u for ur work.
Kindly add buying and selling signal for long term and posional trader.Also another request kindly technical learning guide for new trader.
Thanks once again
Hi Team, Scanner option is good. Is there any option to choose from Daily/ Weekly/ Monthly timeframe? Currently I can see scanning features are available on daily data frequency. For example- Weekly RSI greater than 50.
Thank you.
Hi Chartink team,
Kudos for your work. I have been following chartink for past two years. I have a excellent experience with you. Thank you. Keep it up. All the best for your future endeavors.
How to set scanner for Bullish stock for that particular day.
Eg. I want to see how many stocks closed higher than open.
I tried , latest close, greater than Latest Open.. did not find desired results
Can u add WMA in filter
Can we create our own Watchlist for a scan
We have just added WMA, TMA, ATR & True range within our filter
Hi Team,
I need to calculate the position for parabolic SAR selling or buying position (latest or one day ago) using the scanner to know the trend of the stock. Please let me know how to apply it.
amazing scanner…please extend to weekly,hourly charts.some more indicatorsviz. bollinger bands
etc may be included. can i save my predefined scan parameters?
regards
raju mvs
Very good work.For daily scans on same parameters it would be good idea for the user to save the particular scan so as to save time everyday
Saving custom scans is now possible, click on “Save Scan” on the scan screen to save a scan
hi
still the filter for FnO and the scanner across different timeline charts is pending for update?
These if done would be extremely useful and we are grateful to you for the same.
thanks
Sir, is it possible to scan the stocks which Started reversal movement,if yes please explain the filters.
Thank you
pl. add a feature to run custom scanner on our own watch list .
sir,
I created three scanner in your website all are not working from yesterday pls suggest what to do.Also confirm is this all saved scanner working in market hour
I’m able to view 3 scans that you created,
http://chartink.com/scanner/542
http://chartink.com/scanner/769
http://chartink.com/scanner/935
These scans are running correct and it appears as of today there are no stocks matching your filters(as this running during market hours now). To get the same results as of yesterday, change “Latest” to 1 day ago
thanks akash .pls mention ur twitter account if u use that
Thank you Sir
I am unable to find price filter , like i wish to shortlist stocks price above Rs. 70 to Rs. 1200 , with my EMA scan , how to do it ?
This is quite easy to do, let me know if your facing issues even after going thru our video guide: https://www.youtube.com/watch?v=P77BMG_yGC4&index=1&list=PLpuk1PnOiN3CR8rgURuckWYuEtjjXLFiN
Hi Akash,
I got an introductory mail for scanner from chartink which says the scanner can be run for multiple time frames.
I couldn’t find how to get weekly or monthly candle runs. Pls advise.
Thanks,
Sachin
You can refer this video for the same: https://www.youtube.com/watch?v=xQoSP74IgPo&t=18s&index=3&list=PLpuk1PnOiN3CR8rgURuckWYuEtjjXLFiN
In your website, you have mentioned that weekly and monthly scanner options have started.
Can you post examples of the same?
Eagerly waiting for your reply.
You can refer this video for the same: https://www.youtube.com/watch?v=xQoSP74IgPo&t=18s&index=3&list=PLpuk1PnOiN3CR8rgURuckWYuEtjjXLFiN
Thanks for the reply.I had already gone through your videos before your reply.
they are of great help.
also thanks for adding Bollinger bands scaning in your scanner.
If you take practical for half day we will be greatful.
Also in point and fig charting we can not drraw any lines or erase any lines if any one is using ipad,
Thanking you
Gowree karve
Does the newly added videos help?
how to scan in weekly chart and monthly chart ? ….all scan is done in daily chart
You can refer this video for the same: https://www.youtube.com/watch?v=xQoSP74IgPo&t=18s&index=3&list=PLpuk1PnOiN3CR8rgURuckWYuEtjjXLFiN
open=low high volume,
fast candle range breakout
Hello Shailest,
Here is your required scanner, Kindly review it –
https://chartink.com/screener/open-low-high-volume-44
Hi,
Can you please let me know if the below scan is possible
60 min macd crossover results or
60 min bar crossing 20 sma above or below
Thanks in advance
As of now, only Daily/Weekly & Monthly scans are avaliable
Great progress. Couple of things..
1. Can we have a check box option so as to apply the scan only on the F&O scrips?
2. Also can have a feature to apply the scan only on the watchlist stocks? than the whole universe?
Thanks in advance
We currently don’t have a option of doing so, but shall be adding in future
Have you’ll added running the scan only on a watchlist? If yes can you guide? Thanks
Hello,
Your query is not very clear. Could you please elaborate more on it? Also, please share the screenshot of what you are looking for to review and respond.
How to scan from only Nifty 200 stocks?
Hi sir ….
Thks for all ur efforts for making this easier for inestors but
i want stocks consolidating for certain days help me to get it …….
Here’s a recent consolidation scan that I created: http://chartink.com/scanner/stocks-in-narrow-range-high-150-for-the-past-7-years
Hi Team,
Thanx for doing a good social service job. God always bless you for your work. kindly add buying and selling signal of the stocks for short term, mid term , long term and positional traders before starting of the trading hour.
Thanks,
Bubun.
You can follow one of our saved scans for short term breakouts: http://chartink.com/scanner/short-term-breakouts
When do we buy akashji
Can you make a scanner for candle stick pattern ” Hammer” bullish as well as bearish ??
Hi team,
Can I filter F&O Stocks?
Yes, there’s a option to change the segment: “Stock passes all of the below filters in cash segment :”, click on the “Cash” once on the scanner page to change it to “Futures” segment
How do I filter out Stocks less then Rs. 10 ?
Thanks
Here’s a sample scan that I created for you: http://chartink.com/scanner/stocks-less-than-equal-to-10rs
Thank you ver much sir for your quick reply
I think the scanner needs a tweak like say like I scan
“10 days ago CloseLess than 30 days ago Close”
it scans all the days instead of only “working days”
results are different on friday evening and different on Monday Early Morning.
please look into it, Thanks
On Monday, if you tried during Market hours, after 9:30am, the “latest” would refer to Monday, as Scans are updated during Market hour with a delay of 15 minutes
agree, but the “10 days ago CloseLess” line counts saturday and sunday aswel and narrow downs the results…
No, only Market trading days are considered, so, “10 days ago”, would include 10 market trading days(excluding all holidays). Can you give me a example scan for the issue you are noticing?
Thanks and Kudos to Chartlink Guys .. screener is very useful, keep it up for us..
Thanks for your feedback
i want to scan when tenkan sen cross kijun sen in ichimoku .please advice
Here’s the screener: http://chartink.com/screener/tenkan-sen-conversion-line-crossed-above-kijun-sen-base-line
Hi there,
I was trying to create a scanner so I can find scripts that opened HIgher then Yesterday’s High,
but unfortunately it gives wrong results
here is the link: http://chartink.com/screener/hh-1
am I doing somwhere wrong? please Help
Thanks
Sandip P
The scan that you shared, considers the close rater than the open. Here’s the correct one: http://chartink.com/screener/copy-hh
Thank You very much
Can you please guide me “Bullish Engulfing” and “Bearish Engulfing” candle stick pattern in live market.
You can refer this: http://chartink.com/screener/bullish-engulfing-pattern-1
Bearish Engulfing can be created in a similar way. Let me know if you have any doubts
Thank you sir.
But i asked not this.
I need engulfing patterns in the live market.
The scan that I shared, would have it results updated during market hours(15 minute delay). You can either keep the screen open and click on “Run scan” every minute to get the latest results Or just refresh the page
TataGloabal is accured 10:30 am Bearish Engulfing pattern that time stock price is 156.20.
Hexaware is accured 09:55 am Bullish Engulfing pattern that time stock price is 243
This type scanning needed.
The scan that I shared, would have it results updated during market hours(15 minute delay). You can either keep the screen open and click on “Run scan” every minute to get the latest results Or just refresh the page
I want to find stocks whose Latest Low is within 10 % from the bottom of the previous 5-day Max-Min range of High Low.
i.e I want to scan for [Today’s Low – 1 Day ago Min(5,Low)] Less than equal to [o.1 *{ (1day ago Max (5,High)-(1day ago Min(5,Low)}]
This requires bracketing to specify order and relationship of the arithmetic operations. I find I am not able to implement such a scan.
Here’s your Screener: http://chartink.com/screener/screener-for-p-ramakrishnan
Also, we have added “Brackets” as a function but we can skip that in this screener as operators are evaluated form left -> right
Let me know if you have any doubts
Dear Sir,
How to select BTST/STBT stocks?
I suggest you review our popular scans here: http://chartink.com/#top-scans
Which shall give you a idea on how to go about creating your own custom scans
Dear Sir,
How to identified sharp surge stocks?
Please guide me.
Dear Sir,
How to find out daily morning after pre-open time ( 9:08 am ) ichimoku span line above opening stocks?
pls guide me.
You can refer: http://chartink.com/screener/ichimoku-uptrend-cloud-crossover
Our prices are delayed by 15 minutes, so you’d get latest results at 9:30am IST
Dear Sir,
How to setup when the senkou span A crosses from below to above the senkou span B.
Thank You sir.
You can refer this scan: http://chartink.com/screener/copy-ichimoku-uptrend-cloud-crossover-rsi
Dear Sir,
Please setup Cci 20 cross above CCi 100 with Rising Volumes.
Dear Sir,
Will you please guide on making a scanner for stocks
1) above Rs 25
2) closes above its 30 days High
3) weekly or Monthly High Volume
Thanks
Sanjay
………
1) above Rs 25
2) closes above its 30 days High
3) weekly or Monthly High Volume
4) 2 days ago close less than 30 days ago
5) 3 days ago close less than 30 days ago
6) 4 days ago close less than 30 days ago
7) 5 days ago close less than 30 days ago
8) 6 days ago close less than 30 days ago
9) 7 days ago close less than 30 days ago
Have you tried adding the filters that you’ve mentioned in our scanner?, here: http://chartink.com/screener
Hi. Could you please help me getting a scanner for stocks given Positive results from Negative results on QoQ and YoY basis
Dear Sir,
Just wanted to know what is the time delay in chartink scanners to that of the live market???
We have a 15 minute delay for the stock prices on NSE
Dear sir,
Chartink is superb website. We are identify stocks every time refresh website, otherwise you can provide any SMS service for our scanning pattern.
We’ll be launching an alerting system soon
Dear Sir,
how to find out below 50 dma stocks?
You can refer this screener: http://chartink.com/screener/200sma-crossover
And change 200 to 50 to get a 50 day SMA/DMA
dear sir,
what is the meant of Latest Open Greater than number * 0.01
If the open is 100, “Latest Open Greater than number * 0.01” you mean, the open is greater than the number * 0.01, if you put 100 in place of the number, it would be 100 * 0.01 = 1 ( 100 > 1 )
Hello Akash,
Kudos, brilliant website, really very useful, thanks!!
On EOD basis, I want to scan those stocks which are in a 2% distance of the 20D High / Low and 55 D High/Low.
Also I want to scan those stocks which hit the 20D and 55D high /low in today’s trade.
Thanks in anticipation!!
Thanks!!
Thanks for your feedback. Kindly refer this scan: http://chartink.com/screener/stocks-which-are-in-a-2-distance-of-the-20d-high
You can change 2% with (1.02) or 5% with (1.05) number value.
This is the best site for screening of stocks. Using this site we can screen stock considering daily time frame. My request is, can u add weekly time frame also. Like, weekly macd cross over, weekly over sold, weekly moving average etc. That would be very helpful for long term investors.
Weekly/Monthly ranges are already provided, kindly refer this example: http://chartink.com/screener/weekly-rsi-overbought-oversold-scan
how to choose time frame while building a filter
Hello,
You will get the filter option by clicking on the “+” sign. You can click on any one of them as per your scan requirement. You can observe that “Latest ” is the default timeframe that will be chosen.
You can click on “Latest” to select your required timeframe. You will get the options in the dropdown list.
I hope this helps.
your site is doing a wonderful job Cheers!!!….I just had a query, the site says ‘Custom Scans now updated during market hours’, what is the estimated time lag for updating the charts as compared to actual market??
Its 15 minute delay for the latest price (candle)
thanks buddy, God bless you!!!
Is this time lag there for premium/paid users as well ?
Free version data is delayed by 5 minutes. In premium subscription, charts and scans are updated every minute. Our premium members get realtime data with updates every minute for our Charts & Scans. So if you run a scan at 9:20am for example, it would be based on the latest data until 9:19:59am and so on..
pls improve delaytime in data from 15 minutes to 5miutes so that its more beneficial for trader as well as investor.
Could you please change the ATR formula and Display similar to the following site:
http://stockcharts.com/school/doku.php?id=chart_school:technical_indicators:average_true_range_atr
– as there is a difference in calculating the end number with respect to other sites.
It is wonderful . Please keep it up. Suppose I create a scanner viz open = high and run it by 9.30 am, will it show the current day details ? Is it possible to provide EOD Heikenashi charts in your charting platform? That will be very useful. Good job and carry on . All the best to you.
You should get the current day’s data by 9:25-9:30am daily (as we have 15 minutes delayed data from NSE). We’ll be adding “heikenashi ” soon in our EOD charts.
how to find stocks nearing (or just crossed) all time high price.
Here’s your scan http://chartink.com/screener/stocks-at-lifetime-high
We have more than 12+ years of data in which you can scan
Thank you
I want to create a scan, which should give current monthly RSI is greatest in past 12 months.
As per your guide lines, I have written the following formula.
Monthly Max(12, Monthly RSI (14)) equals Monthly RSI (14)
Is the above formula is correct ?
If I am wrong, kindly write a correct formula for me.
Thanks in advance.
Bhushan
You scan is correct, we have more than 12+ years of data in which you can scan
Akash Sir,
Thanks for the reply,
Bhushan
Is there any way to use close price even when scan run during market hours, I don’t want to use current prices, instead want to refer yesterday close always, so if I run after current day mkt close then it should use current day close otherwise should refer previous day close price? is it possible?
You can refer to yesterday’s close as “1 day ago close” to do this
but if i use “1 day ago close” and run same scan after mkt close then won’t it refer previous day close, while I want it to refer current day close when run on current day after mkt close.
Yes, currently that’s the only way possible.
We’ll be soon adding a date filter, allowing you to run the scan as per a given date(the latest would refer to the data as of the given date)
Adding date would be a great advantage so please add i soon
Yes, we shall add them soon
This is one of the most comprehensive filter tools available for free at the moment. Great job!
I did have one question though. After running my scan, I am given a few columns most of which are unimportant to me, while the important columns are missing. Do you guys allow customization of the columns on the Result Table?
Thanks.
Currently there’s no provision to have custom columns. We’ll plan on adding that in future though. Any specific columns you are looking for?
In my primary custom scan, I would like to mainly have an RSI column.
in scanner,it is returning close price. I want to have open price also
How to scan stocks making higher highs?
You can refer this scan: http://chartink.com/screener/stocks-at-lifetime-high
Dear Sir,
website not updated why sir?
Pls update website immediate sir.
we are miss wonderful website.
Dear Akash,
Thank you so much for this lovely website, I refer this website to many to use it.
Please include Triple Exponential Moving Average (TEMA) for a Customized Scanner as an indicator along with Exponential Moving Average (EMA).
Thank you,
Regards
Vishnu
Dear Akash,
Thank you so much for this lovely website, I refer this website to many to use it.
Please include Triple Exponential Moving Average (TEMA) for a Customized Scanner/Screener as an indicator along with Exponential Moving Average (EMA).
Thank you,
Regards
Vishnu
We shall add TEMA soon
Dear Akash,
Thank you so much for your response. Eagerly waiting to see Customised TEMA in Scanner & Screener.
Warm Regards
Vishnu
Hi Akash,
Can I expect TEMA in updates on Scanner/Screener by this month end? It would be a lovely tool to work on as compared to EMA. Kindly update ASAP. Thank you so much.
Regards
Vishnu
We are working on adding more indicators along with TEMA, I can’t commit on a date yet as we’ve prioritized our user’s feedback by the most received ones, but in the next few weeks we shall add that. I would surely keep you updated on the same.
Can you please provide an update on this?
chartink is a great website after started using my trading methodology has changed totally, thanks for the team.
I do have a question what is the difference between crossed above and greater than on closing basis because I’m getting two different results I couldn’t understand
Thanks for your feedback. “close crossed above 50” means the close was below 50 yesterday and has closed above 50 today(indicating a crossover).
Sir,
What is the difference between “7 Days ago” and “1 week ago”
as when I put this line >
“Volume” Greater than “7 Days ago”
and
“Volume” Greater than “1 Week ago”
the results are different…
Thanks
“n days ago” refers to daily candles whereas “n weeks ago” refers to the weekly candles. You can change the range of the candles shown in our EOD Charts from its default to “daily” to “weekly” or “monthly” and refer these candles within our scanner with “n weeks/months ago”
Dear Sir,
It is a Marvelous Charting tool, Thanks a lot
my doubt is in editing “How to insert new line in between”
Regards
Ramnagaraj
“How to insert new line in between” is this question in regards to the scanner? Can you explain more on this
How to set macd indicators sell & bay for 5mint can6
Below is an example scan on MACD crossover on 5 minutes candle:
https://chartink.com/screener/macd-line-crosses-above-macd-signal-3
sir, when using ema crossover scan it gives me name of a stock but when i look that stock on zerodha kite it shows no crossover has happen. why is that
I’ll suggest you verify the crossover on our charts. For EMA we considering datapoints for more than a year, I’m not sure how its done in other charting sites
Hi Akash,
How can we know a Crossover instantly? Is there any method to detect crossover immediately?
Regards
Vishnu
You can run the scan during market hours to identify crossover that happen while the markets are open (data to the scan is delayed by 15 minutes same for the our Charts)
Dear Sir,
Pls setup 3% high, low compares previous close.
Dear Sir,
i want to scan the stock which is very low changes in price
for example stock x day 1 .. open 82.05 high 82.10 close 82.00 low 81.90
day 2 .. open 82.10 high 82.15 close 81.95 low 81.85
You can create the filter based on the % of difference form its day’s high
Sir
Suppose i want to use 5 min , 15 min or 1 Hr candle stick charts
then how to filter the stock base on above charts
For example: i want to filter stock whose 1 Hr close is above the ichimoku cloud then how to filter the same. same condition with 5 min and 15 min charts
We don’t have Intraday time frames yet
First I would like to thanks the Chartink team for doing the wonderful job you people have done for Indian investor by developing the new customs scans.
It has really helped us to scan the stocks based on different indicator or oscillator. I would hereby request you people to please upload the Heikin Ashi charts and the scan for Heikin Ashi Bullish and Bearish Engulfing pattern. As they provide to be good indicator of trend reversal.
Thanks for your feedback. Sure, we shall plan on adding that soon
Dear Sir,
Please guide in making Narrow Range 7 (NR7) scanner
Thanks
Shankar
You can refer this scan: http://chartink.com/screener/nr7-improvised
Hi ,
Can you please help me in getting the consolidation zone for the shares. How to scan for the shares getting consolidated ,I mean bouncing between a support and resistance level from say 2-3 months.Thanks for the help!
Regards
We have created 2 scanners for these
http://chartink.com/screener/short-term-breakouts
http://chartink.com/screener/potential-breakouts
Team,
I am looking a scanner 20 days cross over with 200 week candles. Please assist
regards,
Binny
Hi someone please help me create a scan from stocks trading above 50 weekly moving average and below 50 weekly moving average thanks
Hello,
Sure, below are the links to your scan. You may make another scan for trading below accordingly.
https://chartink.com/screener/close-greater-than-weekly-50-moving-avg
hi
can some one help me in creating 2 weeks average low value
(sum of 10 days low / 10)
Below is your scan:
https://chartink.com/screener/2-weeks-average-low-value-sum-of-10-days-low-10
You are looking for 20 day high cross above 200 weekly candles?
sir is there possible to use( OR ) condition in scanner like this’
A and (B OR C and D and E)
time frame 30 min or any INTRA DAY
A =(0 candle latest close > 1 candle high )
B=(1 candle close is 2 candle close)
D=( 2nd candle close <3rd candle close)
E=(1st candle close <2nd candle hidh)
so sir please guide me that as how to apply OR in above query .
if possible than please send me
Yes, you can have “AND/OR” condition by specifying stock matches “ANY/ALL” conditions. Here’s an example scan using OR condition: http://chartink.com/screener/macd-bearish-or-bullish-crossover
I could have created your scan, but was unable to find what the C condition was, let me know if you have issues in creating the scan now
sir please give me your contact no so i will explain you condition.
Can we have a complex composite of AND/OR ??
LIKE
(condition 1) and (condition 2 OR condition 3)
Hi,
i was trying to get the below results. tried various combinations,, not sure ,
4 hourly chart EMA above 50
1 hour chart ema above 50
5 mins chart ema above 50
Please help
Here’s your scanner: http://chartink.com/screener/stocks-above-ema-50-in-1-hour-and-5-minute-chart
Currently we are still in the process of collecting data for 4 hour chart, so add the condition after 5 days so that we have 50 candles available
I want only amt display 490 590 690 is it possiable
Dear chartink team
I am using your scanner to filter out stocks and very happy to get this service that too free. I am very much thankful to you for the excellent service.
Now my question is intraday time frame m5/m15/m30/h1 are live or delayed data?
Thanks for your feedback.
Intraday data is delayed by 15 minutes, the same for our Charts & Scanner
Sir please turnover option in filter to calculate VWAP
VWAP is also imp indicator so please add turnover option in filter
I have applied this filter
Latest 1 hour close crossed over super trend of various parameter but result are not as per filter
Please let me know whether I am applying wrong filter or something else.
Kindly ensure that the supertrend is based on the 1 hour time range as well
I want only amt display 490 590 690 is it possiable and last month close and 5 days avg volume greater then 20 percent ok give me reply
Kindly explain what you mean by 490 590 690
How to take daily traded value as filter??
You can do “volume * close” to get the daily traded value
sir how ( or ) relation work if applied on 3 or 4 condition on single screener.
A= weekly current close is > one week ago high
B= one week ago close > two week ago close.
C= two week ago close > three week ago open.
D =(0 candle latest close > 1 candle high ) ( 30 min candle)
E=(1 candle open is > 1 candle close) red candle ( 30 min candle)
F= (1 candle close is > 1 candle open) green candle ( 30 min candle)
G=(1st candle close 2nd candle close) ( 30 min candle)
above condition in bellow relation for single save screener =
A and (B or C) and D and ( E or F and G and H)
sir please please make such screener.
You can use “Sub-Filters” to have AND/OR condition, here’s a example scan using them: http://chartink.com/screener/futures-crossover
Hi i want to scan only nifty 50 stocks how to do that
We currently don’t have a group of NIfty 50 stocks, we shall add that shortly
Hi Akash,
Once again, thanks a million for providing one of the best scanners available in the market; that too for free.
Had a request that would help a lot in intraday scanning, i.e. selecting “Today” Candle for Intraday Scans.
Please consider implementing it, that will take away need to duplicate code/criteria setting many numbers of time.
In order to explain my request more specifically as to how “Today” option can help reduce writing similar code numerous time in Intraday Scan; currently, there is option of 0,-1,-2,-3,-4 and so on for Intraday times i.e. for 5, 10, 15, 30, etc. So in case of crossovers during any intraday time frame right now we need to define every candle from that time frame to identify the crossover. But in case if “Today” option is available, then it would be fairly easy to define crossover for any intraday time frame through one line code as against per candle. I hope I have been able to explain my point.
Thank you very much, Akash.
Thanks for your feedback. I understand your query and we shall soon be adding a “as of date” filter, to run your scans as of a given date rather than the default of “Today”
Cheers !! Akash 🙂
Hi Akash, Any update on this request? As this would provide real good benefit for intraday scanning.
We’ll be releasing this soon. I’ll send you a update over mail
Can u pls tell me if it’s possible to find which stocks gave a bullish supertrend in the 15 mins or 1 hour timeframe charts?
Also is it possible to find out which stocks rsi crossed 50 in 15 mins or 1 hour timeframe charts?
I need this real-time during market hours. (15 mins delay is ok)
If yes… Please provide the scanner formula.
Yes, here’s a example: http://chartink.com/screener/supertrend-sellll-55555-min
today i scane for http://chartink.com/screener/daily-buy-8 .
daily ema 100 is less than 50 or daily ema 20 is less than 14 it gives in result m&m and lichsgfin though both are is sell ( with respect to above mansion ema daily ) . sir pls reply
I’m unable to find them in the resultset now. Kindly confirm if you are still facing this issue
Could you please add EMA based Keltner Channel with ATR band as style as an indicator, also add the same available in the scanner as well?
Bro Jayesh here (9370700600) i also wanted to create one scanner which based on ATR bands and ema with Heiken Ashi candle
Pls contact if you can help
Hello,
Currently, all indicator-based scans are run only on Candlesticks and not on Heikin-Ashi candles. Hence doing this for ATR won’t be possible. You can add the EMA with the Heikin-Ashi candle. Here is an example scan below for your reference:
https://chartink.com/screener/ema-9-crossing-above-ema-21-on-heikin-ashi-candles-daily-timeframe
Excellent work… One request…. needed data filters for other time frames..
You can refer our F&O for this: http://chartink.com/articles/scanner/stock-screener-faq/
Akash sir ( team chartink) thank you very much for making such very useful tool and quick reply for any query . sir i have few addition if you feel considerable 1) add open interest data 2) same technical tool with fundamental data for scan as like in screener.in 3) make it live real time chart and auto refresh live scanner ( obviously WE READY TO PAY AFFORDABLE CHARGES )
NOTHING IS FREE IN THIS WORLD WHICH IS PRECIOUS EXCEPT CHARTINK.COM.
Today i thing site is under maintenance as scanner not showing result from noon to till now evening 6.30 pm , SIR PLEASE I REQUEST YOU THAT DO MAINTENANCE AFTER CLOSING MARKET.
THANK YOU CHARTINK TEAM.
Thanks for your feedback. Yes, we are working on additional fundamental fields within our scanner. Also, we shall avoid maintenance during market hours in future
thank u sir for your reply …..in chartink there was cross over so its seen in screener … i think some difference in calculation of super trend . but no problem i love chartink.com. my all time best website. lots of star for team*************************** thanks .
Dear Sir,
Thanks for very beautiful analytical tool, Want to know when can open interest parameter can be added in scanner.
Hello,
Currently we support only NSE cash stocks and indices. We do plan on adding others in the future. Shall keep you posted.
ok now working sir.
hello sir , today i face problem regarding hdfc bank 60 min chart as it shows price is cross super trend 7,3 upward but when i check on other online chart like sharekhan and tredercokpit super trend is still bellow prize. is there any problem with super trend formula data calculation . pls reply
Kindly verify the crossover within our charts here: http://chartink.com/stocks/hdfcbank.html
I’m not sure the formeulea used by other sites
akash ji how to screen the stocks on 5 minute time frame.
(5 min candle low value is greater than 5% of Bollinger band upper band line.)
Hello,
Here is your scan for the same:
https://chartink.com/screener/low-greater-than-upper-bollinger-band-by-5-5-minute-timeframe
wow, what a superb tool for traders and investor…..I feel blessed to find this website with screener and hessel free / convenient. Cant believe life can be so simpler and without spending a penny for the same.
FIRST OF ALL ITS GOOD TECHNICAL SCANNER !!
is there any delay during live market ? I want to scan first 5 min( 9.15am to 9.20am) tick so can i scan at 9.21 am?
There’s a maximum delay of 5 minutes & a minimum delay of 0 mins, data is updated every 5 minutes, so if you want to scan for stocks between 9:15 & 9:20, run the scanner around 9:21am.
Hi Akash,
Please explain me, how to use ‘Buy orders Vwap and Sell orders Vwap.
Your design of the website is superb …..I have few requirements, please let me know there feasibility.
1) Back Testing.
2) Multiple watch lists or grouping of stocks in watchlist
3) Adding stocks to watch list from scans
4) Bar Count function which can compared.
Ex :: Bar count (EMA50 Crossed EMA200 last time) > 10
5) Max and Min functions accepting expression as inputs for number of bars
EX :: Max( Bar count (EMA50 Crossed EMA200 last time) , High)
6) Date at particular event
Ex :: DATEAT(HIGHVALPOSSINCE(RSI(14) crossed above 30,HIGH,1))
7) Max and Min values since a particular Date,Date can be arrived by Date function.
Hope i’m clear in my requirements.
Please respond on each point on feasibility and by when can we expect.
We have recently added the ability to have multiple watchlists and run scans from a particular watchlist.
I read thru all your inputs and many of them sound good, we shall try implementing your inputs in the coming few months
Sir, Is it possible to BackTest our scanners so that we can be sure whether that scanner is good for the selected stock or not?
If that is possible, please guide me how to use that.
Thanks a lot in advance.
Currently you’ll need to manually change the “latest” to n days ago to backtest your scans, we shall soon be adding the ability to run back dated scans
Chartink is a very good website
I want to know if intraday data is real time or delayed?
Akashji, how to start adding selected stocks in Watchlist group?
Once you’ve registered, you can go here http://chartink.com/watchlist_dashboard and starting adding stocks to your watchlists
Hi Akash,
Have noticed that scans that are NOT marked as Public are also appearing in the suggested Public scans list (Related Screeners List that appears below scan results). Request you to please check and fix it if you could.
As always, appreciate your contribution to the community.
Regards
Sameer
Sure, I shall look into this
Hi Admin,
thank you for such a great screener, i have a problem finding values how to screen some thing like this … 20 SMA is 5% greater that 50 SMA and 50 SMA is 5% greater than 100 SAM kindly explain thanks Shahjahan
We have many such examples for stocks near SMA/Highs, I’ll suggest you review thru them here: http://chartink.com/screeners/search?search_term=near
hi,
when BSE EOD data will be available for writing analytics.
thanks
ankit
Probably in the next couple of months
Hi akash, Greetings.
it would be helpful if we can add multiple stocks in watch list at a go…can we do it in present scanner.
This is possible, we’ve just added the ability to have multiple watch-lists’ and use them in your scans
Hi Akash,
Your scanner works superbly, need your help as mohamed also asked for, need to add multiple stocks in one go in the watchlist, currently we have to search the stock and then add to the watchlist, what if we can add the mutliple stocks in one go in watchlist, instead of adding one by one.
Thanks
is it down at present?
We had scheduled maintenance activity ongoing, things should be working now
Thanks for Mutiple watchlist.
Please look into providing option to bulk upload Stocks into this screeners from EXCEl or CSV or like google finance upload option where we can copy and past mutiple stocks in search box and we get all this stocks added into watchlist.
Sure, sounds good. We shall ad this in our todo
Thanks for Picking it up.
I like the way you are ready to adapt to user requirements and update. Great Job
One more thing i want to highlight
-You would be saving all the requirements that are coming from users,If you can publish the todo list of changes, it would be of great help for us to Understand what is coming and people also can give suggestion once we have the view of list.
Sure, we’ll add a feature tracking system, probably using JIRA to help user’s keep a track of todo items and vote for them
how to create candlestick / pattern scan..?
for eg. last candle should end with a Hammer , ( or other specified )
You can browser to various candlestick patterns here: http://chartink.com/screeners/candlestick-patterns-screeners
You could either search existing ones or create a new one matching your own criteria
Akash,
Thank you very much for providing such a wonderful screening ability, I am in process of creating 15 min ORB scanner , I need list of stock when it break first 15 min candle anytime during the day. Could you please help me here
I recommend you review a few ORB scanners here: http://chartink.com/screeners/search?search_term=orb
Thanks Akash for quick response. I looked all the ORB scanner but I am still not able to understand the logic how first 15 min ORB scanner works when price breaks 15 min range any time during the day, how we can capture the first 15 min range in query. e.g stock ABC first 15 min range (9:15-9:30) broke on higher side after 12:30 how should I write such query as offset is not known in advance(it can be anytime any candle after 9:30). I look all the query but coundnt find. Following query looks interesting but not sure if it will do the job or not
LatestCloseGreater than[-1] 15 minuteHigh
so if I run this query at 12:32, it will give me only those stock where latest price at 12:32 is higher than 12:15 candle.
Correct me if I am wrong and help me in capturing first 15 min range in query.
I also heard from someone that you have paid services with more advance future but I coudnt find any option can you provide me more detail on that.
Thanks,
You correct, currently to refer to the first 15 minute candle of the day, you’ll need to manually need to specify the offset -5 or -10 depending on when you are running the scan during the day, we shall be soon adding a function to help you with this.
We plan on having premium services providing alerts via SMS/Email along with a additional features, we are in the process of finalizing it, once done, I’ll surely share the details with you
Thanks Akash, please do let me know once you have premium service specially alerting feature.
Sure, i’ll keep you updated
Akash ,
What is the latest close while markets are open. If I use latest close and intraday offset e.g [-1] 5 min close, how latest close will work here
Thanks,
Ashwin
Latest close shall refer to the CMP whereas, -1 5 minute close refers to the previous candle on a 5 minute candlestick chart. So, if the current time is 12:30pm, “latest close” equals “12:30pm” & -1 5 minute refers to the close at 12:25pm
Thanks Akash for detailed explanation so If I use ** Latest close and [0] XX minute close **** both would refer the same price, right ?
is this correct understanding ?
Thanks,
Ashwin
Yes, you are correct
Cool, if I use volume instead of close with latest and [-1] 5 minutes than , latest volume shall give me day volume till point and [-1] 5 shall give me previous 5 minute volume, please confirm?
Yes, correct
Hello Akash …i have question related to intraday scanning…suppose i want to scan SUPERTREND crossed below first 5 min candle in live market at around 11AM its difficult to scan such situation as I have to count number of 5 min candles on chart and then replace this count no in place of
[0]5min….instead it would be of great help if we can replace [0]5 min with time like 9:15 candle crossed below 5min close
Yes, we don’t have a function for the same recently, so the only way possible is to count the no. of candles backwords until 11 am. We’ll soon making on adding this thru a function
Hello Akash
Is this functionality of getting results for a particular point in time available?
I want to find the Highest of the Highs between 1:39 pm and 2:15 pm.
Currently we can plot the same on Atlas dashboards. We can check for a stocks high within a particular time frame
Hi,
I was trying to create a crossover for Stochatic for latest crossovers. I have created below scan, but it does not seem to give the correct data. IT shows crossovers which are older like 15 or 20 minutes back
Stock passesallof the below filters in cashsegment :
LatestSlow Stochastic %K(10,3)Crossed aboveLatestSlow Stochastic %D(10,3)
Modify parameter
I’ll recommend you verify the breakouts within our Charts, as the formulea used should match with place you are viewing the breakouts in scans.
Hi Akash,
Wonderful efforts, best scanner seen so far.
Need your help in creating new scanner with the following
5 Day Absolute Price Change > 100 Day Standard Deviation
5 Day Average Volume < 75% of 5 Day Average Volume
The first filter wouldn’t be possible as of now as we don’t have a std deviaation function. For the sencond condition, did you mean 10 days avg volume < 75 % of 5 days avg?
Thanks admin, i would like to screen some thing like, the prices are ranging between 20% to 30% for past 6 months. also kindly do let me know about the use of bracket value and how to apply it.
thanks
You can achieve the same using our min & max functions to help calculate the range of price for the past 6 months
Hello sir,
Sir i want to creat a scanner in 1hr chart in which cmp close above previous higher high in buy side and in sell side cmp is close below previous lower low. Please help me.
Thanks.
How would you define “previous higher high”, is it the past 10 candles on a 1 hour timeframe? Or more
Hello sir.,
I mean to say that previous swing higher high and swing lower low in 1hr chart.
Here’s an example: http://chartink.com/screener/swing-high-scanner
You can change 5 minuet to 1 hour to get a similar behaviour
Yes i got it
Thanks Akashji.
Hi Akash,
Aren’t these two quires same? Why am I getting different result set?
Query 1:
Stock passes all of the below filters in cash segment :
Latest Close Greater than 1 day ago Close
Latest Close Greater than 2 days ago Close
Latest Close Greater than 3 days ago Close
Latest Close Greater than 4 days ago Close
Latest Close Greater than 5 days ago Close
AND
Query 2
Stock passes all of the below filters in cash segment :
Latest Close Greater than 1 day ago Max(4,1 day ago Close )
Your second query, should be:
Latest Close Greater than 1 day ago Max(4, Latest Close )
As we want to refer to the current close for a day within the max function
Dear Akashji,
I want to create a scanner for a list of stocks which have crossed the 200 EMA in the 5 day 5 min chart today. Also today’s volume should be higher than yesterday’s volume. Also can i get live alerts for the same on my email. Please help in creating the same.
Hi Dipesh,
Created scanner for your requirement.
http://chartink.com/screener/5-day-5-min-200-ema-crossing-for-dipesh
Akash recently, mentioned Email / SMS alerts will be rolled out in the near future.
//Mohan
Dear Mohan,
Thanks for the screener.
Just wanted to know if i run the scanner at EOD, will i be able to get the list of all the stocks that have passed through the screener today.
Yes. Infact, even if you run it during trading hours, you’ll get the latest results of the trading day
Dear Akash
I really like the way you are assiisting us in various queries
I need your help to set up a scanner for BUY volumes over a period eg last 5 days or last 4 weeks
Regards
Dhiren
You’d first need to identify what conditions/filters would identify a stock with increasing BUY volumes, would it be closing positive with rising volumes? OR close up by a fixed % over the last few days
Dear Akashji,
I have created one screener in which the parameters is weekly CCI crossed above 0. If any day i miss the screener and if i want the results of the screener on any other day how can i get that?
We’ll be adding a date condition soon to help you run the scan as of a particular date.
I discovered the website today. Registered and created a few filters/scans. Impressive. I would like to know how to confine my scans to Nifty 50 or Nifty 100. Please guide.
We have this documented within our FAQ, here’s the link: http://chartink.com/articles/scanner/stock-screener-faq/
Notice the watchlist questions, you’ll find nifty 50, 100 in the same dropdown
HI ,
Can i know how to use this tool for macd crossed above 0 signal
You can refer this scan: http://chartink.com/screener/macd-crossed-above-signal-line-1
Hi,
Charts are static as of now.can you please provide
1)Date range option on charts(Ex :: want 1 year daily candles starting from Jan 2016 to dec 2016 only)
2)Horizontal movement of chart to view last 5 years data with constant page layout
this will be helpful to validate strategy on past data.
Yes, these are on our todo list & we plan on implementing this soon
Hi Akash,
you where about to share the todo list in the form of Jera Link.can you please share that
It was probably over the mail I guess
Over the mail also fine,can you please share it
Reminder…… can you share me the list
Can you suggest any available scanners or how I can create a scanner to filter stocks with 45% slope over last year or couple years ? For eg, to filter stocks like Bajaj Finance, Vakrangee who have a consistent upward graph for last year/s ?
You could use a min function on a monthly timeframe and check if the minimum % gain in a month is more than 5% every month for the past 1-3 years
Thanking you very much for creating so much useful site. Please let us know if you start any premium services.
Is it possible to get a screener for Double bottom chart?
Sure. You can refer Double bottom stocks here: http://chartink.com/eodscanner/Double-Top.html
Sorry. I need the formula behind screener so that I can edit as per my my need. That link is giving directly screened list.
SIR,
I reqest you to put VWAP indicator in this scanner because its a very useful indicator for intraday trading, it gives very good signal for up or down trend.
HI ,
I want scanner for PIN BAR 1hr duration both positive & negative .
means 9.15 mkt starts ,i want to see pin bar at 1000hrs (positive ) & negative botyh seperate means 2 scanner.
pls guide .
rgds
anand ahuja
Refer PIN BAR scans here: http://chartink.com/screeners/search?search_term=pin+bar
hi sir
i want intraday scan of 15 min time period for FNO stocks
1) stocks crossing ichimoku cloud above and below
unable to set scaner kindly guide
Excellent Tool. Why not provide for a simple import csv feature for watchlist ?
We have that in our to-do list
when you are planning to implementing this ?
Hi,
As of now i can make markings on Charts and save that externally, but do you have any plan in implementing saving of studies online so that when i open that chart again, i can see my markings with new candles data.
Yes, we plan on allowing that soon
Hi,
One more thing.
On 30 min chart your first bar is from 9:15 to 9:45 and last bar is from 3:15 to 3:30 right
Can you change this to first bar is from 9:15 to 9:30 and last bar is from 3:00 to 3:30.
As most of the charts that i use have that format(Google Finance,Moneycontrol, Traderscockpit etc)
Could you please look into this.
We’ve kept it starting from 9:15 because Indian markets don’t open at the start of a hour, most of the markets world-wide start from the start of a hour(eg: 9:0am). The calculations from 9:15-9:30am wouldn’t be accurate enough to consider in a 30 minute candle period
But if select [0] 30Min in you screen after market, it is considering 3 to 3:30 PM, but once we open chart, we have bar from 3:15 to 3:30 only, its confusing
can you move as requested above
Dear Akash
Thanks for your revert on my query about rising volume. I will be interested in closing positive rising volume.
Dear Akash
I notice that when I use the below query “Weekly CLOSE crossed above SMA (Close, 20)” it does not give me the closing price above Middle Bollinger band. What is the problem with my query??
Thanks
Dhiren
If you want to refer to the WEEKLY Middle bollinger band, use the below filter instead
Weekly CLOSE crossed above WEEKLY SMA (Close, 20)
Dear Akash
I want your help to define a query for positive volume ie increasing volume over a specific time frame ( daily, weekly, monthly). I have tried using moving averages but cannot achieve the desired result. Thanks
Dhiren
Hi ,
I need some help in writting below code
On a 30 min chart apply RSI and 50 EMA, now i want to know all stocks that met below criteria
1) close of any 30 min bar today should have crossed below 30 min EMA 50
2) MAX RSI value between (bar closed below EMA 50) and (bar closed above EMA 50 before to this closing below EMA 50) should be 70.
In other words,
Stocks Close should have crossed below EMA 50(of 30 min) today for the first time after RSI has crossed below 70(this can be today, yesterday or so on)
Hi ,
I am looking for simple moving average (SMA) 9 crossingover SMA 20 in hourly chart and in monthly chart.Could you please help?
Also is it possible to get the latest date which it crossed over?
I’ll suggest you search thru our SMA crossover screeners here: https://chartink.com/screeners/search?search_term=sma
yes it is possible
Hi ,
‘RNAVAL’ is missing from Futures watchlist.
Thanks for notifying, this has been added
Dear Akash,
How can i scan the stock’s 15.min close crossed above 200 Sma during live market any time or at the end of the day.
Please refer this example: https://chartink.com/screener/15-minute-stock-breakouts
I want to develop code for today’s RSI is greatest for last 1 year?
How to develop this code ?
Thanks in advance.
You can use the min/max functions for this
Can you create the same for me.
I have not understood the how to use minimum and maximum formula fully.
can we use this scanner in live market? I want to know about Any delay for the data?
Yes, we provide near real time data updates, more details here: https://chartink.com/articles/scanner/near-real-time-updates/
It is seen that, the stocks filtered are in a massive lot, one can not find out the stock added in the list very recently,it is missing and not possible to find out from the mass list. how can we find out the stock time wise or number wise?
what is the formula can be used to find out the stock running now day’s very low or high in 10 minute chart?
We’ll be adding the ability to show the recent stocks soon
Anybody will suggest for short term 10-15% gain in stock for very short term.
thank you.
You can refer the below 2 scans for short term
https://chartink.com/screener/short-term-breakouts
https://chartink.com/screener/potential-breakouts
How to screen moving average cross on the basis of hlc/3.
It is showing only open, close, low and high price.
Please guide. Thanks
You’ll need to manually calculate “high+ close+ low / 3” using the mathematical operations
Can you create the scan for stocks, which has moved up between 5 to 8 percent after creating 52 weeks low.
I have tried with using minimum and maximum function, but not able to used it correctly.
Can you create the one for me ?
Thanks in advance.
Yes, refer the potential breakout screener for this: https://chartink.com/screener/potential-breakouts
Hi Sir,
My requirement is last 26 weeks of ATR 21 value is below 20 and latest ATR 21 is crossed above 20, I tried it but it showing different values please guide me. https://chartink.com/screener/copy-ds-weekly-atr21-above-10-4
You’ll need to use the max function for this, I have created your scan here: https://chartink.com/screener/copy-atr-21-2
sir is it possible to create scanner like
1- prize current or latest close
ABOVE OR ( GREATER THAN OR EQUAL TO)
vwap ( volume weighted average prize)
2 – prize current or latest close
BELLOW
vwap ( volume weighted average prize)
We currently dont have the vwap indicator, but we plan on adding that soon
I’m a beginner I daily visit ur site for analysis 1.can l have the signal line for RSI that is EMA for RSI. 2. I want to learn swing trading how can u help me 3. Tell me about interperting P. F. chart and RENKO CHARTS(is it available).
I’ll request you review our scans here: https://chartink.com/screeners
It contains a lot of examples and is similar to your requirements
Dear Sir,
Requesting you kindly add PASS ANY SUB FILTER facility in filter section, which will give great output for all traders.
We have this present, kindly refer this guide: https://chartink.com/articles/scanner/scanner-user-guide/#sub_filters
I want to scan stock close above and below 26 day simple moving average with +7 days displacement.
can u share how to do it ?
You are looking for a 26 SMA crossover 7 days ago?
Yes Sir, 25 days simple moving average with 7 days (displacement)
Its Called display moving average
Here’s a example for that: https://chartink.com/screener/displacement-moving-average
Nice website very helpful for deeply analysing charts
Thanks for your feedback
Sir How to Moving Average Crossover Strategy
Here are some examples: https://chartink.com/screeners/search?search_term=moving+average+cross
sir is it possible to create scanner like
SMA 50 cut by any 15 min candle
Yes, you can use combination of filters like:
Latest SMA(close, 50) crossed above 15 minute close
hi sir
i want to screen out stocks based on OBV breakout in recent 6 months. But there is no OBV option in indicators of screener.But it is in charts . So pl. add OBV in screener.Also tell me how to make screen for that.I am living in rural part of ratnagiri district maharashtra.So pl. help me
I’ll suggest you refer some sample scans on OBV here: https://chartink.com/screeners/search?search_term=OBV+
Pls provide “Previous Day/Week/Month High/Low” indicator. This indicator should draw horizontal lines for the 3 highs & 3 lows in different colors. We should be able to select/deselect any or all of the high/lows.
Thanks
Sure, we’ll add this in our todo list
Sir,
please let me know how can i scan stock close above & below 25 days Displaced moving average with 7 days displacement.
Here are examples on displaced moving averages: https://chartink.com/screeners/search?search_term=displacement
how can scan close prize 3% above his 200 daily moving average
Refer this scan: https://chartink.com/screener/jttimes-stocks-near-200ma
It checks stocks near 200 SMA plus minus 2%
Hi
I would like to find the whether the volume of the current candle is greater than the average volume of past n candles
will this work ?
Latest Volume > sma(Volume,n)
Thanks
Hari
Yes, this is correct
I have below scanner and wants to know the diffference between crossed above and greater than. Looking as the name, seems both will give same result but they are not.
Stock passesallof the below filters in futuressegment :
LatestCloseGreater thanLatestUpper Bollinger band(20,2)
LatestVolumeCrossed aboveNUMBER100000
I think I got it now after analyzing the indicators on graph. lastest crossover means today itself it crossed the close or volume whereas greater than means it might have crossed the price or volume yesterday, week before or month before…
Great scanner. thanks for making it for free. I learned a lot from this site and soon will become successful trader.
Any chance to include 3 m time frame?
Thanks for your feedback. We may plan on adding that in future
buy letest cci over sold.
macd cross over.5/20/9
super trande 7.3
super trande 10.2
super trande 11.2
How to make scan for the stock where latest close price is greater than 13 day EMA by 2%
and increasing volume in last 5 days
You can create a filter like:
“Latest close greater than Latest ema(close, 13) * 1.02”
Sir, please tell me what do you mean by 15 min delay? Does it mean only the first 15 minutes, i.e. 9:15 to 9:30 the scanner is delayed or is it delayed 15 minutes till EOD 3:30 for all timeframes? Or it is real-time but the first 15 minutes till 9:30 only is delayed? Thanks
Data is not delayed.
Please refer the detail here: https://chartink.com/articles/scanner/near-real-time-updates/
This site is very useful to track the market.
Please add following indicator for scanner.
– schaff trend cycle
– Awesome oscillator
Sure, we’ll plan on adding this
hello akash sir
how to create scanner like
1 hour latest rsi period 14 cross above 1 hour latest rsi average 9
or
1 hour latest rsi period 14 cross bellow 1 hour latest rsi average 9
SMA/EMA functions currently works only for stock attributes(open, high..), we’ll be adding the ability to make them run for indicators as well to get moving averages as per your requirement
I want ICHIMOKU’s day filter, where trending line crosses over base line and this cross over should be above cloud. Please reply.
Please refer examples on Ichimoku clouds here: https://chartink.com/screeners/search?search_term=Ichimoku
Hi, your website is really helpful.I have noted all important points. I more wanted to know about candle indicator.Can you please mor elaborate on this.
I’m not sure what you meant. Please provide more details
Amazing Scanner….
Have few questions:
1. How frequent is data updated? Is it real time?
2. How to create a scan fulfilling following condition: (5 min time frame)
Bollinger Band Squeeze- Upper bollinger band (20,2sd) less than (sma 20 + ATR 14) and Lower bollinger band (20,2sd) more than (sma 20 – ATR 14) on 5 min candlestick chart
Data is updated in near-realtime, details: https://chartink.com/articles/scanner/near-real-time-updates/
I’ll suggest you view examples on bollinger band squeeze here: https://chartink.com/screeners/search?search_term=Bollinger+Band+Squeeze
first of all thank you for your effort to build this site i was looking for such site for since time.
my query is i want to know stocks which gained in each month like
stock abc gained in jan 2017 10% then feb 2017 5% .
can we apply any filter here to achieve this?
You can do that using the monthly timeframe, a filter such as:
” Bracket( 2 months ago close – 1 month ago close ) / 2 months ago close * 100 greater than 10
AND Bracket( 1 months ago close – monthly close ) / 1 months ago close * 100 greater than 5″
hello and regards,
I am speechless after i review you website. i must say for get money-control or whatever other websites available in the market for stock picking. you guys are simply awesome. You all know what trader or investor need for taking entry or exit in the market. hope you all update site time to time. this website is incomparable to any other website available.
with screener if you guys add backtracking than it will be complete one. hope you will do soon.
Thanks for your feedback. Yes, backtest is in our todo list.
HI akash sir,
Is there any operation i can perform to figure out whether any old swing pivot has broken today. For example; if i can perform operations to see whether any double top or double bottom broken out today or this week etc.
Thanks..!
There are examples of Pivot breakout here: https://chartink.com/screeners/search?search_term=pivot
Here’s a example for that: https://chartink.com/screener/displacement-moving-average
you where about to share the todo list,can you please share that.
Hi,
When we write a lengthy screener on intraday candles, it become tedious to remember the reason we wrote that sub filter at later time.
could you provide a notes section at sub filter level, it would be easy to remember for the person who wrote and the anyone who is looking at it on sharing.
Sounds good, I’ll plan on adding this soon, thanks for your feedback.
Can you please look into this behavior and let me know the reason and fix
1) if i write {Latest Min(107,Latest Rsi(14) ) Greater than number 30 }, i get DMART in result.
but if write anything more than that say 110 or 120, it does not give the output.why?
Dmart RSI did not go below 30 from start that is from 209 days
2) same behavior with (Shankara) after 97
if i write {Latest Min(105,Latest Rsi(14) ) Greater than number 30 }
I have around 33 stocks some issues like this, i got this on comparing multiple Scans
This is because we go back over a year to calculate indicator values, DMART & Shankara have been listed a few months ago and there’s lack of data to accurately calculate the RSI for it, hence the discrepancy. This will automatically correct once the stock matures along with its data
It is awesome website, really it is a great help for retail trading community who cant offer paid scanners and want to do their own research.
atleast for me it is really really great help to select stocks and to form new strategies. thanks to the chartink team
Appreciate your feedback, most welcome
i have a query please help me out, how do i write find those stocks which are not yet crossed the 1st 15 min high low, i dont want the breakout but i want to know those which are still trading in 9.15 candle range (between high and low)
We’ll be soon adding a start/end of date candle function to help you achive this, as of now, depending on the time of the day, you may need to adjust your offset
thanks for your quick reply akash, i have a suggestion as well as request. The most important section of Scanner is MATH FUNCTION and the most complicated section also the same one, people like me having basic knowledge cant understand completely about these functions by seeing other scan examples. My humble request is to do a exhaustive video just for MATH FUNCTION section so that we can utilize this section for betterment of our scanners. Please….
Sure, we’ll be adding few more math functions in the coming few days. I’ll plan a video on that shortly
Hi Team,
Great Work, Keep it up.
I was notified that now indices are added to scanners/alert.
How can i set hourly crossovers of EMA(high, n) on Nifty?
Yes, here’s a sample for Nifty(& other indices) hourly crossover: https://chartink.com/screener/nifty-and-indices-hourly-crossover
Thanks Akash for prompt response. Let me check and get back.
I want to create a scan filter ” latest High crossed last 5 days high”.
please help me by creating the scan .
latest high greater than or equal to 5 day ago high
Dear Akash,
I’m a beginner for chartink. I’m planning to become a premium member. I need below formula,
[0]5 Min High is greater than { [0]5 Min Low + it’s (Low’s) 2% }
For Example, Low Prise is 100 & High price is 110, So I need 110 is Greater than (100+(It’s 2%)2)102
Also i need,
[0]5 Min Low is Less than {[0]5Min High – it’s (High’s) 2%}
Vimal
Need script for
close is greater than [ High – 0.5% of High]
close > (high-(high*0.005)
i.e.,
Latest Close Greater than Bracket (latest high – bracket(latest high *number 0.005))
same way u can calculate for your earlier formula also
Thanks Harish.
@Vimal: Here’s your scanner: https://chartink.com/screener/close-is-greater-than-high-0-5-of-high
Can you help.. i want to make one scaner
plese give your email id .. i can explan…i am a biginer
hi akash,
i just want to bring your kind notice that supertrend is not operative once it crosses 64 parameter.
if i change supertrend parameter for 65 multiple 3 i.e., SUPERTREND(65,3)
it is not showing any scan results in hourly please look into it.
Yes, I’ll have this checked. thank for notifying
no need to thank me akash, actually we need to thank you for such a gift for trading community.
we are just joining hands with you people.
Hi Akash,
The scanners don’t seem to be working today. The results shown are of 12th Feb for all my saved scanners. Please look in to it.
Thanks.
This has now been fixed. There was a issue that impacted daily candles.
Working fine now. Thanks !
Hi Akash,
There seems to be an issue with scanner related to MA crossing (I have been noticing this issue past one week). For example, I suggest, you can try scanning 50 crossing 100 for the current or past candle in 15 minutes or day or month. On verifying the results you will see that the result shown is not correct.
Regards
Sameer
I verified a couple of scans and the results seem accurate, here’s an example: https://chartink.com/screener/golden-cross-scan
Please validate the crossovers in our Charts
Hi Akash,
Request you to check for 50 EMA Crossing Above 100 EMA in (both past candle & current)
a) 15 Min
b) 1 Hour
c) Daily
d) Monthly
And you will realise my observation is correct and there is an issue with scanner results.
Thanking you in advance for you time and efforts.
Regards
Sameer
Can you please give me the link to the scan for the same? And also a name of a stock that’s not correct. Would help me validate the results
Hi Akash,
Have created following scan as an example.
https://chartink.com/screener/50-crossing-above-100-15-mins
In this following stocks got identified.
1 Bosch Limited BOSCHLTD
2 Krebs Biochemicals And Industries Limited KREBSBIO
3 Parabolic Drugs Limited PARABDRUGS
4 Pearl Global Industries Limited PGIL
5 Shree Rama Newsprint Limited RAMANEWS
If you look at 1,2,3 you will notice that 50 is crossing 100 on different candles rather than on the current candle as should be the case as per the scan code.
Secondly, 4 & 5 rather there is a Bear crossing of 50 & 100 and not Bullish that too at different candles rather than current.
Further, there is also the case of code not picking up all the crossing that has happened at a point in time.
Similarly, if you alter the current 15 Minute Candle to 1 Month selection, you can notice a similar case of incorrect scan results. Infact, till yesterday for past two / three days the monthly scanner was showing NIACL in result of Monthly 50 crossing above 100 which cannot be possible since that scrip does not have enough monthly candles to be part of scan itself.
You will also find issue with the scan of 1 Hr candle.
Hope, I have been able to highlight my point. If not, please share your email id, I can send you screenshots for a better explanation of the issue on hand.
Thank you for your time and efforts.
Regards
Sameer
Hi Akash,
Sorry if this is a duplicate reply. But I can’t see my earlier reply somehow here, that is why I am writing this again.
Have created this scan for your validation.
https://chartink.com/screener/50-crossing-above-100-15-mins
When you check the results shown you will realise my point about incorrect scan result.
Further, if you change the time frame to Hourly, Daily & Monthly and validate the scan results you would also realise that results are incorrect.
Hope I have been able to convey my observation this time. If not, please provide me with your email id and I will send you screenshots to explain my observation.
Regards
Sameer
Thanks for the details.
We have just fixed this issue.
hi akash,
i have a request, please add TOTAL BID QYT and TOTAL ASK QTY to scanner options so that we can find such stocks where people are one sided on trend.
thank u akash Supertrend 144,3 is working
Akash i am looking @ scanner specific dates 06/02/2018 stocks which have broken low and 31/01/2018 stocks which have broken high
Hi Akash
My query is I want to scan stocks which have broken low of 06/02/2018 from current price.
Also I want to scan stocks which have broken high of 31/01/2018. Thank you.
Hi Akash,
First of all great work in providing the scanners.
Could you please help. I want to have a scanner which can show the stock jumped 30% in 3 months. percent and month can be changed.
P.S: I work in IT. So if I can help and be part of chartink team. I will be more than happy.
Thanks for your feedback, here’s your scan: https://chartink.com/screener/stocks-gaining-30-from-their-3-month-s-low
I HAVE REGISTERED FOR MONTH SUBSCRIPTION WANT TO SEND SMS ALERT FOR EMA CROSS OVER AND RSI
I have sent the details over mail.
How to write “Last 40 (5 mins) candles is greater than 200 Rs.” ?
You can use the min/max functions for that, so you can do:
“[0] 5 minute min(40, close) greater than 200”
How to scan only for stocks in my watchlist?
select watchlist option instead of CASH or FUTURES
Is the offset 1 day ago for the present day 22/02/18 (since I am writing this on 22/02/18) as the market has already closed for the day or is it for for 21/02/18?
As on 22nd Jan’18, a offset of 1 day ago would refer 21st Jan’18 as soon as the market opens at 9:15am.
hi akash,
sorry for disturbing you again, am facing some problem with Supertrend when i change parameters the scan is not giving proper results actually i tried with 200,3 parameters and for buy it is not showing anything and for sell it is showing all the stocks which are in futures. am giving u the link below can u please check it ….
https://chartink.com/screener/super-trend-144-hourly-breakout
akash sir please add rsi average , vwap indicator and if possible for fno open interest change % for scanner . thanking you.
RSI Average has been added, you can do it within SMA itself. We’ll working on adding the other request’s soon
akash sir please send link for ( rsi 14,9) daily rsi 14 cross above daily rsi avarage 9 or cross bellow . what changes in sma for rsi average pls guide sir . thanks.
hi akash,
sorry for disturbing you again, am facing some problem with Supertrend when i change parameters the scan is not giving proper results actually i tried with 200,3 parameters and for buy it is not showing anything and for sell it is showing all the stocks which are in futures. am giving u the link below can u please check it ….
https://chartink.com/screener/super-trend-144-hourly-breakout
I’ll look into this issue
i want know about StochRsi(14).
in other chart has 2 lines.
Excellent, easy to use scanner.
Can you add the leading indicator – Klinger Volume Oscillator in your list.
Thanks
Sir,
I have to scan a method in 15 minutes candle stick :
-3 , candle stick , cross over, -2 candle stick high… how can i apply this formula
Hi Akash, I’ve designed scanners (for intraday) which scan stock which are at near day’s high and day’s low. Here’s the script for day’s low.
Latest Close * NUMBER 0.995 Less than Latest Low
but it takes previous day’s low as “latest low”. is there anyway I can get today’s Low?
Thanks.
Can you please re-try and let me know if you are still facing this issue? Latest should refer to the current trading day when markets are open
Hi Akash, It’s working as expected now. perhaps I was doing something wrong. Thanks for the quick reply.
How could I create my WATCHLIST.
I don’t find on help or FAQ
You can visit watchlist dashboard: https://chartink.com/watchlist_dashboard
And create a watchlist & then add stocks within it
what are abs, Ceil, floor and round in math functions? and how to use them?
can any of these be used to find stocks in channel?
These are common mathematical functions, can be used as any indicator/stock attribute
Awesome tool. Is there anyway to restrict the stock selection to only those that are in a particular index or combination of indicies (S&P, dow stocks only, Russel, etc) or that trade on a particular exchange (NYSE)?
Can you please add double EMA ( DEMA ) in indicators ?
I am newly joined
Great work done by Chartink also facility
I want to know about Backtest of my scan.
Presently i cant find the backtest.
So i can easily examine my scan for knowing about scan was doing wrong or wright.
Sir,
Please set Backtest for formulas useful to reutilisation of formula.
Thanks
hi akash,
had raised an issue regarding supertrend scanner, but still is it not resolved please look into the issue. its a request please look into it as soon as possible.
can u please suggest me a screener which filter the following…… 5 min price crossing first fifteen minutes high or low …..how to put first/opening 15 min high low in screener….
I wish I can move alert sequence after creating them, when multiple alerts are created using a scanner. Makes it simpler to review.
I wish I can copy an alert, if i have to use it the 2nd time in the scanner with some variation. I can save time in coding the same.
I wish the alerts are available at 1min, and 3 min as 5 min is too much time for an Intraday/ swing trader.
Your prices are almost same as in.tradingview.com, and I subscribe to both. Your scanners are better, but trading view provides real time data. Ideally, either of the websites moves ahead in features, I will drop the other.
Excellent screener!! hats off to you guys!
I wanted to know how do I refer to first 15 min candle?
Hi,
Tell me how to scan only nifty 50 stocks urgent.
can you please add %change as one of field so that we can filter based on %change. I am looking at 2.4% when i check any time today.
This is a great tool to find the relevant stocks. Appreciate all your effort.
I have one question – how can I refer the first candle of the day (let’s say first 15 min candle) and make decision based on the candle behavior. For example, Open = Low within 1 or 2 candles at the beginning of the day. I may like to check the same for any previous day.
Thanks in advance for your guidance in this regard.
Dear Sir,
How we can set filter for supertrend indicator.
Dear Sirs,
1.I want to find Narrow ranges stocks less than 1% range
2.I want to find NR3 stocks
3.Is there any training class, or paid services for these scan service.
Pleas reply.
Thanking you sir,
Yours sincerely,
M.KUPPAIAH, Email- [email protected]
how to use other functional filters like cell, floor and round..
how to average the price for last 30 days…
and one more thing..can you please add hull moving average…
Thanks
Hi Akash ji,
The chartink screeners are wonderfull to filter the stocks. Thanks a lot providing such a nice website.
Could kindly guide on the following requirement:
From the last 100 days, i want to find highest-high value achieved for a particular stock. Among the mentioned 100 days, the filter must find the highest price the stock has ever touched. Currently i am only able to find the latest high; not the highest-high.
Thanks in advance.
Regards
Ramakrishnan
You are looking to filter stocks at their high’s when compared with the past 100 days? If so, you can use our max function for this
Dear Akash,
Could you please call me in 9790798798.
Call me urgently.
Thanks
Arun
We provide only email support, please feel free to share your doubts on email
Mr.Aakash,
I got subscribed and getting alerts at faster than my expectations.
Thanks for all.
I am advised one thing to be deployed for your services grant to the trader.
I observed that many persons having little effort and knowledge towards market and needs of trader tie up with Zerodha, as they allowed to direct deploying the orders into their trade terminal.
Why don’t you go and enhance your potential front frame architecture for fast routed and as well as convenience charges.
Please think big as I am using Zerodha’s streak platform simulation with Chartlink as a semi algorithm trading tool, but haven’t enough logics and comfortable indicators and no customized tools available.
You may free from burdened messaging costs.
Thanking you for your nice approach towards trader needs.
Thanks again for your feedback.
We currently don’t offer brokerage service and would need to rely on other platforms that allow doing so. We’ll soon try approaching them and request them to allow any API calls that allow our users to perform trades remotely
Thanks for quick & fair reply.
Any update on this ? It would be great if you can tie up and allow algo on any of the trading terminal broker
Hi Akash,
Can you please call me on 9819682300
I need subscription.
Thanks for amazing work, keep it up.
Thank you.
Mr.Aakash,
I have a need to looking regards coding a scanner conditions for alerts an EXIT conditions adding within formula and by default all the stocks fulfill the criteria has to be added into a temporary basket like as watchlist to get alerts on exit condition met, or as it may either Stoploss & profit booking alerts as a stipulated %.
Thanks a lot and to be big
hi my name is ankur n i am finding it difficult to use this website i have save some scan in my scanners n i want to know wt is the diffrence between paid subscription and free one
In our premium service we provide realtime data updates every minute for our Charts & Scans along with Alerts for any scans over SMS/EMAIL
Mr. Aakash,
I have to know or notice a need.
I will trying to get an alert on specific stock may it ASHOKLEY crossed > 155 OR crossed < 150, but I couldn't get any idea to built such alert.
Please consider my query not found in FAQ.
It is a betterment of adding VWAP(Volume Weighted Average Price).
Thanks once again for your support.
Yes, you can create a watchlist with a single stock and then create a alert for it
Very Good work by Chartink team. Please do let me know about, time lag, if any, w.rt. to the live market.
Also please help me in creating a scan for VWAP.
There are five steps involved in the VWAP calculation. First, compute the typical price for the intraday period. This is the average of the high, low, and close: {(H+L+C)/3)}. Second, multiply the typical price by the period’s volume. Third, create a running total of these values. This is also known as a cumulative total. Fourth, create a running total of volume (cumulative volume). Fifth, divide the running total of price-volume by the running total of volume.
There are five steps in calculating VWAP:
1. Calculate the Typical Price for the period. [(High + Low + Close)/3)]
2. Multiply the Typical Price by the period Volume (Typical Price x Volume)
3. Create a Cumulative Total of Typical Price. Cumulative(Typical Price x Volume)
4. Create a Cumulative Total of Volume. Cumulative(Volume)
5. Divide the Cumulative Totals.
VWAP = Cumulative(Typical Price x Volume) / Cumulative(Volume)
Thanks for your inputs.
We have just added VWAP in our scans.
akash sir thanks for adding vwap indicator in screener. please vwap also add in chart . one thing remain is rsi crossover to rsi avg. please add this indicator soon in screener. me and my friends waiting for that changes as we want to subscribe premium services . good work sir. god bless you and your entire chartink.com team.
thanks for your feedback.
Can you let me know are you looking for “RSI(14) crossing over SMA(50, RSI(14)”? If so, here’s a example doing the so: https://chartink.com/screener/rsi-crossing-above-avg-of-rsi
hi i need Rolling VWAP of Daily Weekly monthly quarterly & yearly Could you able to make
Hello,
Can you please share the logic/formula you are referring to for the rolling VWAP?
hello sir…
i want to scan stocks near certain levels…
for example stocks near 144 number stocks near 189 number stocks near 289..like wise…
i used crossed above but i want scans of near this prices even like A stock close is 187 which is near 189
can u help me in making this scan possible
how do i put percentage in number?
For +5%, you can multiple the close by “Close * 1.05” or -%5 you can do “Close * 0.95”
what will be the number for 12.85%?
Hello,
For 12.85%, you can multiply the close by “Close * 1.1285” or -12.85%, you can do “Close * 87.15”.
can we have fibonacci retracement screener here
Yes, refer examples here: https://chartink.com/screeners/search?search_term=fibonacci
can we find natural square open, high, low or close
We don’t have this function yet, we’ll plan on adding this soon
ok
hi akash,
supertrend with changed inputs is not working can u please chech out,
inputs (5,15)
Can you please give me the link/url to your scan so that I can investigate
Hi Akash,
My question is on intraday offset for example, I have following scanner
[-1] 05 minute volume > [0] 05 minute volume.
Now consider following scenario
I am running this scanner at 09:27
Question – what offset [0] and [-1] will return ?
will [0] return , volume of current candle which is being formed 09:25-09:30 and
[-1] return volume of 09:20-09:25 candle or [0] return volume of completed
candle from 09:20-09:25 and [-1] return volume of 09:15-09:20 candle, please
confirm
What if I run this test at 09:30
If you run this scan at 9:30 on a minute candle, ” [0] 05 minute volume” will refer to the candle from 9:25:00am – 9:29:59am & ” [-1] 05 minute volume” will refer to its previous candle
what if I run at 09:27 on 5 minute candle ?
May I know the anser for this query?
It will run the query on the incomplete 5 min candle of 9.25-9.30am.
Hi,
Can you just remove the ‘Clause’ Column from scan main page. that is taking lot of area for big scans. So user can see more no of scans on same page.
Thanks
We’ll soon have a provision to hide this column
Hi all,
How do I screen those stocks
1) An MACD(48,89,13) crossover above Zero line in monthly chart?
2) MACD (13,48,5) cross over in monthly chart in any where?
3) MACD(48,89,13) slopping on upside (in Monthly chart) but price is touching 48 EMA (Monthly)?
4) An MACD(48,89,13) crossover has happen before, now the Signal line is crossing the Zero level in daily chart.
These are my four different criteria. Please help me to do the scans.
You can refer examples for MACD Monthly scans here: https://chartink.com/screeners/search?search_term=macd+monthly
Hello….today I have taken your premium service. I want to do my scanning on future data/chart. But here no future data/chart is not available…..only cash data/charts are available for future segment stocks also.
Yes, currently was Scan only NSE Cash Stocks, we’ll be adding BSE Soon followed by Future prices
When you guys are introducing bse cash segment?
Currently we do not plan on adding it anytime soon. Whenever we plan on doing so, shall keep you posted.
Have BSE Cash stocks been added yet? When do you plan on including them in screener results?
Is this going to be available anytime soon?
Currently its not really possible to give an ETA on the same.
HOW TO INSERT PIVOT POINTS IN CHARKINK GRAPHS
We don’t have a Chart indicator for this yet, but you can refer this in our Scanner here: https://chartink.com/screeners/search?search_term=pivot+point
hi akash sir ,
scanner like
1)Latest Open Equals Latest High at EOD 2) [-6]1 hour Open Equals [-6] 1 hour High at EOD . RESULTS RESULTS
SBIN NOT SHOWS ITS MISSING IN THIS SCANNER
DIVISLAB NOT SHOWS ITS MISSING IN THIS SCANNER
DABUR DABUR
JETAIRWAYS NOT SHOWS ITS MISSING IN THIS SCANNER
MARUTI MARUTI
ANDHRABANK NOT SHOWS ITS MISSING IN THIS SCANNER
CHOLAFIN CHOLAFIN
BAJFINANCE NOT SHOWS ITS MISSING IN THIS SCANNER
GODFRYPHLP NOT SHOWS ITS MISSING IN THIS SCANNER
ESCORTS ESCORTS
TATACOMM NOT SHOWS ITS MISSING IN THIS SCANNER
TV18BRDCST,
AND COLPAL
TV18BRDCST, AND COLPAL BOTH BREAKS 1ST ONE HOUR HIGH LATER SO NOT IN DAILY 1 ST SCANNER AT EOD THAT I KNOW BUT WHAT ABOUT SBIN DIVISLAB JETAIRWAYS ANDHRABANK, BAJFINANCE, GODFRYPHLP AND TATACOMM WHY THOSE STOCKS ARE NOT IN SCANNER NO 2) ? EVEN I CHECK OPEN AND HIGH AT NSE SITE TO CONFORM .DAILY SCANNER SHOWS CORRECT RESULT BUT 2)HOURLY SHOWS SOME STOCK MISSING AS WRONG DATA OF OPEN AND HIGH AT HOURLY CHART IN CHARTINK. PLEASE CHECK ABOUT THIS.
1) https://chartink.com/screener/open-high-daily-1
2)https://chartink.com/screener/hourly-opening-candle-open-high-check-at-eod
EVEN IN CHARTS IT GIVES WRONG HIGH IN HOULY CHARTS LIKE BAJAJ FINANCE IN DAILY CHARTS GIVES CORRECT OPEN=HIGH AS 1875.10 BUT IN HOURLY IT SHOWS OPEN 1865 AND HIGH OF THAT CANDLE 1866 ……..SAME PROBLEM IN OTHER STOCKS…….
The results are correct. Kindly consider the fact that the Daily candles consider the pre-market data, whereas the Intraday/Hourly candles don’t consider them!
ok sir thanks. …. please guide me that which scanner i use daily base or intraday for open=high and open=low.
This is with reference to a previous post for a feature enhancement.
Is this feature released please ? Can we run a scan on a specific date ( n days ago ) rather than manually changing “n” value ?
Best Regards.
“Akash says:
July 4, 2017 at 2:55 pm
Yes, currently that’s the only way possible.
We’ll be soon adding a date filter, allowing you to run the scan as per a given date(the latest would refer to the data as of the given date)”
No yet, we’re planning to add a global offset filter for this as it there are challenges in dealing with Intraday timeframes for same
Hi,
When do we use “Crossed above” and when do we use “greater than “. Please explain.
Thanks.
Crossover checks if the value was below the indicator the previous day and has crossed above it today
SIR, i am using scan alert , how i can add choppiness.
You can refer a scan for that: https://chartink.com/screener/intraday-231241
Please can you also add Ichimoku Chikou Span (othewise please suggest if it is already available – I couldn’t find it) – thanks
The CHIKOU SPAN (“lagging line”) is the closing price plotted 26 days ahead, if you want to refer to this, you can directly select “26 days ago Close”
Hi,
I have your paid subscription of alerts. Is there a way to execute a specific alert at specific time of the day? For example, run an alert at 9:18 am.
Or is there a way to execute a alert between specific time period? For example, run an alert between 9:20 to 9:40.
Is it possible to have such alerts?
You have alerts run a specific time of a day, eg: 9:18, to do so, select “day at time” in the alert frequency dropdown
Akash Sir,
Could you please add “ZigZag” indicator(If possible).
Thank’s…
Hi,
Very nice website.
But Can you add pivot as an indicator on the charts?
Akash Sir
Can you please help me to create the scanner for the following parameters?
7 EMA cross 13 EMA ( Latest )
One day before hourly 7 EMA cross 13 EMA
Twoday before 30 Min 7 EMA cross 13 EMA
Kindly Send me the link to my mail ID Please
Thanks
Sir pllease add positive volume index and negetive eagerly waiting 4 premium membership
I WANT A SCANNER ,WHICH GIVE ME INDICATOR OR SCANNER LIST WHEN-
1- IF I HAVE 20 SCRIPTS IN MARKET WATCH , THEN IN ANY SCRIPT LTP CROSS ATP , OPEN , HIGH , LOW ,CLOSE , PREVIOUS DAY HIGH , PREVIOUS DAY LOW , PREVIOUS DAY ATP. THEN SCANNER SHOW THAT THIS SCRIPT CROSS DAY HIGH , ATP AND OTHER PARAMETERS AS ABOVE .
FOR EXAMPLE
1- SBIN CROSSES PREVIOUS ATP
2- SBIN CROSSES DAILY HIGH
3- SBIN CROSSES DAILY ATP
4- SBIN CROSSES PREVIOUS DAY LOW
Creating these should be quite simple, you can refer VWAP as ATP and use our crossover operator. Then run the Scan against your watchlist
Good Day
Request to introduce candle stick patterns eg Ham mer, Bullish Harami, 3 white soldiers, inverted hammer , morning star, abandoned babby and vice versa in you predefined list of indicators
Thx
Ravi
We have scans based on these patterns here: https://chartink.com/screeners/search?search_term=candlestick
Good Day
Request to introduce pivot point trading system in charts.
Thx
Ravi
Sure, we’ll plan on adding this shorlty
Hi Team,
I must congratulate Chartink for the great website. I have recently bought the premium membership.
I wanted to know how to add pre-market data (top gainer /loser ) to my scan.
Thanks and Regards,
Thank you. For daily candles, the data does contain the pre-market values, so you can run your scan prior to 9:15am for those results.
I want to see all stocks which crossed supertrend (10,4) at 10 minute candle close on yesterday.is it possible?
Yes, this is possible if you set a Alert over it. You can verify this in our ALerts history page then
Dear sir,
Your Website is Superb comparing to any other screening websites.. Very easy to use. Thank you so much for your support..
i want to find 10 moving average crossing both 50 moving average and 200 moving average
Please guide me..
Thanks in advance…
Thanks for your feedback, this is possible, please refer examples here: https://chartink.com/screeners/search?search_term=sma+cross
How can we scan recent swing high break irrespective of duration.
Yes: https://chartink.com/screeners/search?search_term=+swing+high
When we execute a command like
[0] 5 minuteCloseGreater thanLatestWma(close,180)
and
[0] 5 minuteCloseGreater than[0] 5 minuteWma(close,180)
What is the difference.
My purpose is to check whether the price close is greater than WMA 180 on a 5 min chart. Which one will be correct??
The crossover compares the prevoius candle below and current candle above it. If you just want to compare the current candle, use greater than
Hi,
I am trying to create a scanner for inner day (Latest High 1 day ago Low). However it does not seem to work as i am getting back stock which are satisfying only one of those conditions. I have chosen the satisfy “ALL” filters options. Here is a link to the scanner i created
https://chartink.com/screener/ohmm-inner-day
Can you please check and let me know if anything is wrong with the scanner i created ?
e.g It returned me SIEMENS, however it satisfies only the latest low > i day ago low condition.
Any help would be appreciated.
Thank s and Regards,
Om.
The scan and results look correct to me, please recheck
The data for 3rd august is not updated in the scans , I am getting data in the scans as per 2nd August closing prices only in my scans. Kindly check urgently.
This has now been corrected
Aakash, you have made a wonderful scanner. Keep up the good work.
Dear Sir, Is it possible to get alerts for Bullish Engulfing & Bearish Engulfing strictly for Future stocks only ?
Yes, we have a segments filter on the first line of a scan, you can change it to run only against Future stocks
How to use Curent price attribute. Close price is not working correctly
Close for Intraday candles(1/2/3.. minutes) should work fine as the close on daily candles is adjusted against the avg of last 30 minutes
I would like to know about scanner which shows if there is any 1st crossover for day EMA(close,5) and EMA(close,20) on current price. I have created https://chartink.com/screener/copy-20-ema-crossover-61
but its not working correctly. I am getting results after crosseovers happen. I would like to know immediately or in 5 minutes
The scan appears to be based on a daily candle, are you verifying the results on a chart of a daily timeframe?
Yes. How can I get list of stocks if there is first crossover in day.
You can create a alert for your crossover scan & set the alert settings to unique, so alerts would be sent for a stock only the first time it occurs during the day
Beautifully done. So much of filters / and all this can be understood with lay man / devoting just few Hrs in it .. great job.
Hi, I want to get list of stock moving in sideways(Example: 15 Minutes candle pattern moving + or – 1%). Please help
hello akash sir….. trend line se supporting scanner banaa sakate hai kya jaise …Price Crossed Above(or)bellow Falling Trendline …… Price Crossed Above(or)bellow rising Trendline…aap jitnaa ye website improve kar rahe hai aapse ummide bhi badhati jaa rahi hai. ab tak kaa sabse accha website hai ye market ke liye……. thanks for such a wonderful gift for us.
Hi,
I want to scan for the stocks which are near 1% of its 5 day low or high. How do I do it. Any help please?
Thanks.
I need one bullish harami candlestick scanner
Hi, Is there anyway to put current price as an indicator, even in paid option?
Like if I want to live track stock price crosses above 20 SMA for Inraday, is it possible. Please revert
not posibles
Hello Sir,
How to set filter for 20EMA and 50EMA both have above the 150EMA.
Hi Sir
How to set 20EMA Crossed above 50EMA and both were above 150EMA please advice
Dear Sir,
Kindly request you to add functions like Sum (of days,weeks, months), Average (of days, weeks, months) and years data for screening the yearly data.
Thanking you.
Mehul
Dear team,
how to find the high of the past n canldes ?
how to add volume ,please guide
Hi,
I want to know the setting for a scan. I couldn’t find or write one. Once I got the correct setting I will subscribe. Help me to get this please.
Condition:
I need to get alert, When price in 5 mins chart touches last two months(monthly candle) highs or lows.
Hi,
Check if the below configuration helps.
[0] 5 minuteCloseEquals44 days agoHigh
[0] 5 minuteCloseEquals44 days agoLow
hii,
I want to create a scanner on 15 min chart that will alert me when the stock price comes 5% nearer to its 2 weeks high or low. can you assist me in this regard,
thank you.
Yes, this scan is possible. We provide dedicated scanner support only to our premium members which allows you send your scan requirements and we create and share the scan with you.
You review examples scans here: https://chartink.com/screeners
Good morning, I have been looking at your charting and scanning tools and they look very interesting. Is it possible to scan for stocks, ETFs, etc. on the Toronto Stock Exchange (ie. the TSX)? Lokk forward to your reply, thank you and have a great week!
Hello,
No, currently we support only NSE cash stocks and indices. We do plan on adding others in coming days.
I want to create a scan where the latest close is within 10% (above/below) the 52 week low. How may I do that?
Yes, this scan is possible. We provide dedicated scanner support only to our premium members which allows you send your scan requirements and we create and share the scan with you.
You review examples scans here: https://chartink.com/screeners
I WAN TO A SCANNER FOR
BREAKOUT OF SWING HIGH GREATER THAN PREVIOUS CANDLE’S HIGH AND NEXT CANDLE’S HIGH IN LAST 6 MONTHS TIME,
PLEASE GUIDE
You mean current high greater than previous candle and also last 6 months high?
Hi,
you where about to provide a option to back test based on date, what is the status of that.
Example :: simple if i write a code to check ema 50 crossing Ema200 on 15 min chart today.
Now it takes 25 lines of code to check this, but if I want for today and yesterday, i need to write 25 more lines of code along with this 25 lines, but if I can check the same with date change, it would be great.
Simple this can be done by providing an option to set current date, Offset 0 will be the last candle of that day
Hello,
Currently we do not have this feature. We do plan on adding it in the near term. Shall keep you posted. For now, you can create a scan and change it to “1 day ago, 2 days ago, or n number to days ago” to run a scan for the past.
Wow, I have got rs. 1250 profit on my first trade, great works. This is no.1 scanner. I love this scanner
Nice to hear that.. 🙂
Hi, I think it is showing only cash segments. I would like to see the TCS December Future Please help me.
Currently we support only NSE cash stocks and indices. We do plan on adding others soon. Shall keep you posted. We have added a segment filter that can be modified in the top-most filter that scans stocks that are in the F&O segment
Thanks for your response. Eagerly waiting for the segment filter.
Hello, I want to see if open equals low in any of the future scripts (Dec future, Jan future,Feb future).
How to filter those stocks? please advise.
Thanks in advance.
Hello,
There are quite a few scans for open equals low. You may view them here: https://chartink.com/screeners/search?search_term=open+equals+low
To scan for stocks only in the F&O segment, you need to select futures from the dropdown menu. Currently we support only NSE cash stocks and indices. We do plan on adding others soon. Shall keep you posted.
Thanks for your support.
Most welcome
how to use OR(Any) logic between two filters
Hello,
Hope this helps: https://chartink.com/articles/scanner/scanner-user-guide/#sub_filters
Hi,
CAPF, HCC and GRANULES are not part of Fno, can you please look into it and update your stock list for Futures
Hello,
Yes, we are working on it. It shall be updated soon.
Hi Team,
How to write OR condition in scanner for below condition.
(1 st or 2nd candle) of day opening is greater than equal to previous day high.
Please help me on this.
Thanks in advance
Sure, this scan is possible.You may view a tutorial here: https://chartink.com/articles/scanner/filter-stocks-using-1st-2nd-or-any-candle-in-our-scanner/
We provide dedicated scanner support only to our premium members which allows you send your scan requirements and we create and share the scan with you.
Hi,
I want to scan stocks which RSI(14) is only moved between 70 and 30 and not breaked above or below 70 and 30 on entire day in 15 minute chart.
Yes, these scans as possible. We provide dedicated scanner support only to our premium members which allows you send your scan requirements and we create and share the scan with you.
Hi Akash sir. Can you ‘please help me for stocks closes 0.30% near yesterday’s high or low.Thanks.
Yes, these scans as possible. We provide dedicated scanner support only to our premium members which allows you send your scan requirements and we create and share the scan with you.
As a premium member you would be able to:
Access realtime data for Charts & Scans every minute
Create Alerts and receive updates of stock breakouts over sms/email/mobile/desktop
View charts in 1/2/3 minute timeframes with auto-refresh
Run screeners in 1/2/3 minute timeframes with auto-refresh
Scan any watchlist via the segment dropdown of a scan
Get Dedicated support for your scanner requirements
You can get details/signup our premium service here: https://chartink.com/subscription
How can I filter for high beta stocks? (I need beta > 1)
Currently we do not have this feature. We do plan on adding it in the near term. Shall keep you posted.
Hello,
Has the beta filter feature been added to chartink ?
Hello,
As of now we are working on improving our charts. We have forwarded your request to our Development team for future consideration. We don’t want to give you results based on the incorrect data. So, this might take some time. We hope you understand.
We value your patience and look forward to enhancing our service for our valuable users.
Hi i want to scan stocks for first 30 min candle with high and low below “lower bollinger band” with field – (high low/2) i.e. medium, period – 20 , std dev – 1.
Stocks for first 30 min candle with high and low above “upper bollinger band” with field – medium (high low/2) i.e. medium, period – 20 , std dev – 1.
Please email at [email protected] and our team shall review and respond.
how can I get alert?
Hello, We have created a detailed guide on the steps required to create Alerts; please review it here: https://chartink.com/articles/alerts/alerts-guide
It also contains the details of the top scans used on our site; they contain the top 10 scans used for Intraday/Swing & short term trading
How can I add Bollinger %B with (Close, 20, 2 , EMA)?
Please email at [email protected] and our team shall review and respond.
Please How to find open low and open high stock in intraday
Below is the scan for open equals low:
https://chartink.com/screener/open-equals-low-113
We provide dedicated scanner support only to our premium members which allows you send your scan requirements and we create and share the scan with you.
You review examples scans or create your own scan by following our scanner guide here.
Hi,
I want to scan stocks with following filters,
Today’s open > Yesterday’s high
and
Current high > Today’s high at 9.30 am
and
Current close > Today’s high at 9.30 am
How to write above scanner.
We provide dedicated scanner support only to our premium members which allows you send your scan requirements and we create and share the scan with you.
You review examples scans or create your own scan by following our scanner guide here.
Hi
I want to scan stocks where bolinger band is widening 15%
We provide dedicated scanner support only to our premium members which allows you send your scan requirements and we create and share the scan with you.
You review examples scans or create your own scan by following our scanner guide here.
Hi
I am getting alerts with script names in PDF to my email address.
Is it possible to add Open price with the script name in the attached PDF document?
Thanks
Hello,
We send it the email body. We do not send alertsin PDF format. Please share an example on [email protected] and we shall review and respond.
Hi,
Yes, am getting alerts in email body. Currently i am getting email content like below
below is the list of new stocks filtered through scan …
CoalINDIA
RECLTD
I would like to get the list with the open price
CoalINDIA – open price 238.55
RECLTD – open price 133.4
Let me know if you need any other clarifications. Thanks.
Hello,
Currently we do not have this feature. We do plan on adding it in the near term. Shall keep you posted.
It would be great if you could provide in the scan results, all the columns corresponding to each filter.
Hello,
Currently we do not have this feature. We do plan on adding it in the near term. Shall keep you posted.
How do we filter for stock with CMP range?
For example i want to filter only stocks that are between price 150 – 500
Thanks in Advance…
Sure, below is an example scan for the same:
https://chartink.com/screener/latest-close-between-150-and-500
how to filter stock based on stock name or symbol
For eg . i want to create my scanner only for specified stock like reliance , axis or HDFC .
so how can i insure that
Sure, in this case you can create a watchlist with these stocks in it and run the scan against the watchlist. Currently this feature is present only for our premium members.
i need the scan to be specific value for an attribute for a particular stock
For eg., can I build a scan that alerts when a) AXIS BANK latest CLOSE greater than 100 , b) HDFCBANK latest CLOSE greater than 200 ….etc
Currently only way to do this is to run the scan against the watchlist with the stock in it. You can create a watchlist here: https://chartink.com/watchlist/create). Below is an example scan for a stock crossing above 1500.
https://chartink.com/screener/close-crossing-above-1500
You really need to make it easy to add a condition or sub-filter in between lines.
There is no way to add in between lines.
If i have written 10 lines and want to add a sub-filter in between line 3 and 4.
I have to re-write the entire code.
There should be an option to sequentialize the line.
I should be able to select line and drag and drop it below a sub-filter.
Chartink is fantastic but very hard way to do things.
Sure, we do plan on adding this feature in coming days. Shall keep you posted.
sir plz add keltner channel indicator n related scans…
Currently we do not have this indicator. We do plan on adding it in the near term. Shall keep you posted.
Hi
Can we make a scanner to find close of a candle below its midpoint?
Kindly help!
(close – low) < 0.5(high-low)
The above should do..you can check ..
regards,
Vinoth
created the below if you are still not clear
https://chartink.com/screener/closing-below-half-of-the-candle
regards,
Vinoth
Hello,
We have created the scan. Kindly review.
https://chartink.com/screener/close-of-a-candle-below-its-midpoint
Note: We have considered the height of the candle for the midpoint.
Sir I am searching RSI bullish and bearish divergence stocks and divergence has to ceate on top candle or bottom candle. I cant create or find any scan formula in chartink. Can you plz help me on that?
One more query, How to talk with my favourite creator of scanner in chartink? is this possibile to talk with them? plz give me fruitfull solution.
Thanks
Below are scans on divergence created by members:
https://chartink.com/screeners/search?search_term=divergence
We provide dedicated scanner support only to our premium members which allows you send your scan requirements and we create and share the scan with you.
Currently it is not possible to contact other members.
Hi Akash,
I am a premium member.
Can we create a scanner on Chartink which meets below conditions?
Any latest candle is crossing above or below first 10 minute candle of the day high or low?
I know we have clause for crossed above or below but it indicates all stocks which crossed anytime, I want it whenever I run this it should give me at that particular time if any candle is crossing first 10 minute candle high\low?
Thank you
Sure, this scan is possible. Please email at [email protected] and we shall create and send the scan. crossovers and cross below feature does not work on candles. We need to use “greater than or less than”
Hi,
is it possible to create a filter were i would like to compare the %change of stock with %Change of Nifty 50 Index
Ex: TCS % Change in 5 days >= Nifty 50 Index % Change in 5 days
Thanks in advance
Currently we do not have this feature. We do plan on adding it in the near term. Shall keep you posted.
Hello,
I am also looking for this functionality. Is this available as on date? Appreciate your kind response.
Thanks in anticipation.
We do plan on adding it in the next couple of months.
Is the feature now available ?
Hello,
Currently, it is not possible to give an ETA on the same. We shall keep you posted.
Is the feature added now? Can you please let me know?
Sir i want fibonacci 61% ,50% & 38% please guide me how to creat that scan
Sure, below are scans on the same created by members:
https://chartink.com/screeners/search?search_term=fibonacci
Yes, these scans as possible. We provide dedicated scanner support only to our premium members which allows you send your scan requirements and we create and share the scan with you.
Hi,
I would like to know the time frame to use this scanner.
Time frame will help me to run the scan and check.
Please reply.
what is the first candle of day
[=0]
or
[=1]
Its =1
can we add any colomn to the result?
Like the following coloumns come in any scanning result: Name/Symbol/%chng/Price/VoL.
Can i add any customize column like previous Low / StopLoss(which came after some calculation) etc.
Hello,
No, currently we do not have this feature. We may plan on adding it in the near term. Shall keep you posted.
How to run scan for the stocks in my watchlist
It is a feature in our premium version. You can choose the same from the dropdown menu.
How to add my favorite stocks to watch list all together rather adding one by one ?
If this is one time job, you may email us the list of NSE codes at [email protected] and we shall create a watchlist from the back-end.
Is it the real price shows up in the free version of chartink or a delayed price?
Free version price is delayed by 5 minutes. Our premium members get realtime data with updates every minute for our Charts & Scans. So if you run a scan at 9:20am for example, it would be based on the latest data until 9:19:59am and so on..
Dear Sir,
I am premium member,
I want create scan high or low break of 15 min. second candle by 5 ema in 5 min. time frame. I have tried it but clause shown [-1] candle which I have not set. I need only day 15 min. 2nd candle high or low break alert by 5 ema in 5 min time frame.
Please suggest.
Regards,
Hello,
We did receive your email and have sent a scan, please review the same and reply.
Dear Sir,
I want to create a scan where I would like to compare month end close prices, eg March end close is less than April end close. Is it available. The month ago functionality takes month ago close and not month end.
Also if same functionality of week end close comparison is available
Thanks
Yes, this is possible. Below is an example scan which checks for current months close is less than 1 month ago close. We can do this for weekly also:
https://chartink.com/screener/monthly-close-is-less-than-1-month-ago-close
How to find out the first 15 min candle that breaks high/low of opening 15 min candle and use that candle’s attributes in subsequent filter?
You mean currentl 15 min candle breaking high/low of days first 15 min candle?
Sir ji i want this scanner, latest open is crossed above (Gann 45 degree)one day ago low
Hello,
You may view scans created by members on Gann here:
https://chartink.com/screeners/search?search_term=gann+45
https://chartink.com/screeners/search?search_term=gann
How to make Gann degree scanner in chartink ?
Hello,
You may view scans created by members on Gann here:
https://chartink.com/screeners/search?search_term=gann+45
https://chartink.com/screeners/search?search_term=gann
SUPPOSE I HAVE SET A SCAN ALLERT, IF A STOCK REPEATS FOR 3 TIMES IN THAT ALLERT, BUT THE ALLERT SIGNAL I M GETTING FOR ONLY 1 TIME FOR A STOCK IN A DAY. I WANT ALLERT SIGNAL EVERY TIME IT COMES.
IS IT BECAUSE I HAVE SET ” UNIQUE” in my modify allert setting?
what do you mean by “unique” and ” duplicate” in modify allert settings?
Yes, you are correct. you will need to change it to “duplicate” to receive alerts for the same stock again.
Sir,
If i want to scan just Stochastic RSI bearish crossover at top and bullish crossover at bottom on daily charts, is it possible here ?
Yes. Below is an example scan for Slow stochastic crossover:
https://chartink.com/screener/slow-stockhastic-crosses-above-50
You can start by reviewing out top scans here: https://chartink.com/screeners/top-loved-screeners
They contain the top 10 scans used for Intraday/Swing & short term trading
Good morning Team,
Thanks for the good website.
Can you please give me scanner for 200-50 simple moving average above/below for 1 day candle stick?
Thank you for valuable time.
Hello,
Below is an example scan of stocks crossing 50 or 200 SMA.
https://chartink.com/screener/stocks-crossing-below-sma-50-200
We provide dedicated scanner support only to our premium members which allows you send your scan requirements and we create and share the scan with you.
Hey Guys,
This is a my fav tool to work on however it lacks a few basic features, so its been a few years since the bulk stock upload to the watch-list has not been implemented, can you guys implement this feature, its a hassle to write each stock name considering everyday I have 50+ new stocks to watch??
Quoted from above…
“Please look into providing option to bulk upload Stocks into this screeners from EXCEl or CSV or like google finance upload option where we can copy and past mutiple stocks in search box and we get all this stocks added into watchlist. ”
Thanks.
Hello,
Sure, we do plan on adding this soon. Shall keep you posted.
Hi,
Is there any option to create filter for trading patterns like Head and shoulder, Cup and handle pattern. I am looking pattern for the period of 2-3month time frame.
Sure, there are a few created by members. You may view them here:
https://chartink.com/screeners/search?search_term=head
https://chartink.com/screeners/search?search_term=cup
is there a way to add one more filter to list the stocks only in F&O segment? i mean, my scanner should be performed on stock cash prices and the output only filters the F&O segment stocks among the list we got in the first cash filter?
Yes, you may choose “futures” from the drop down menu. Currently we support only NSE cash stocks and indices. This segment is created to run scans on stocks that are in F&O segment.
Sir, how to apply Indicators on Custom time frame, for example how to scan if RSI(14) of 5day chart crossed below Lvl 30
Here I am not asking 5 days ago RSI(14) CROSSED BELOW 30 …….no no no NOT THIS
I am asking for how to fileter stocks based on custom time frame indicators.
PLEASE HELP !
I am not understanding your query. Can you please email us at [email protected] . Our team shall review and respond.
Sir, Today we can scan stocks based on certain criteria selected in filter.
Is there any way can I screen the future and options???
For example,
1) I want to screen stocks whose future value is below the current stock price.
2) I want to screen stocks whose future value ends with round figure like 1300/1250/1400 etc.
3) I want to screen all nifty options whose value is less than 10RS or based on the any specific value.
Currently we support only NSE cash stocks and indices. We do plan on adding others soon. Shall keep you posted.
HI,
This is really good!
I am waiting for the Future and Option scanner to be updated 🙂
I have seen screener gives below condition:
“Stock passes allof the below filters in nifty 50segment :”
Can we have
Stock future price passes allof the below filters in nifty 50segment :
OR
Can we have
Stock/Index Options passes allof the below filters in nifty 50segment :
???
Hello,
Currently we support only NSE cash stocks and indices. We do plan on adding others soon. Shall keep you posted. We can have the same for Nifty50 Cash segment
Great job chartink.com team
Every scanner inside indicates one great trading lesson…
small traders like me its most affordable…
this site is “TRADERS PARADISE”.
Thank you for your kind comments.
Hi, is it possible to add US stocks for scanner.
Thanks.
Hello,
Currently we support only NSE cash stocks and indices. We do plan on adding others soon. Shall keep you posted.
Thank you so much…
Most welcome
Sir i want to add multiple OR condition in my query like 1 day ago SMA cross OR 2 days ago SMA Cross OR 3days ago SMA Cross over happen… How will be the query.. Please guide me.
Sure, for this you may use “stock passes any” function. Below is an example scan for the same:
https://chartink.com/screener/close-crossed-above-sma-20-today-2-3-days-ago
Another option is to click on “back-test results” and you will be able to see crossovers for previous 150 days
Sir, but there is no OR condition. How to us multiple AND, OR
Hello,
It is possible using sub-filters. Hope this link helps:
https://chartink.com/articles/scanner/scanner-user-guide/#sub_filters
Kindly explain the function – floor and ceil.
The CEIL() function returns the smallest integer value that is bigger than or equal to a number. Note: This function is equal to the CEILING() function.
In mathematics and computer science, the floor function is the function that takes as input a real number and gives as output the greatest integer less than or equal to , denoted . Similarly, the ceiling function maps to the least integer greater than or equal to , denoted .
in the alert setting on some alert, I have set email notification but I am getting desktop notification also. what should I do?
Hello,
You may go to browser settings and disable notifications for chartink.com
sir, sub-filter within a sub-filter work or not?
Yes. it will work
Hi, I am premium user. I am trying to building a scanner but i am getting confuse. Could anyone from the chartink team help me to create a scanner if i give the details. Kindly reach out to me through my email. Thank you
Sure, I have emailed you
Hi ,
I want to create filter with below details . Can you please help
1 hr ago close greater than 2 hr ago close.
2 hr ago close greater than 3 hr ago close .. so on.
Yes, below is an example scan:
https://chartink.com/screener/1-hour-ago-close-greater-than-2-hour
This scan and many others are possible. We provide dedicated scanner support only to our premium members which allows you send your scan requirements and we create and share the scan with you. You review examples scans or create your own scan by following our scanner guide here.
As a premium member you would be able to:
Access realtime data for Charts & Scans every minute
Create Alerts and receive updates of stock breakouts over sms/email/mobile/desktop
View charts in 1/2/3 minute timeframes with auto-refresh
Run screeners in 1/2/3 minute timeframes with auto-refresh
Scan any watchlist via the segment dropdown of a scan
Get Dedicated support for your scanner requirements
You can get details/signup our premium service here: https://chartink.com/subscription
DO you support indices option price scan??
For example, i want to know low of option price hit my desired value of say 25.5rs
Currently we support only NSE cash stocks and indices. We do plan on adding others soon. Shall keep you posted.
Dear Sir,
Can we have a scanner for a condition where a Renko brick changes from Red brick to Green brick. (Renko 1 ATR).
Also when one Green Brick is formed.
Thanks
Ashok
Hello,
Currently we do not support Renko charts. We do plan on adding it in the near term. Shall keep you posted. This is possible in candlesticks.
dear sir , pls help me for making screener , i want to make a new screener for near life time high stocks with maximum 1% to 20% gap ( gap in current price to all time high price )
Hello,
Below is a example scan for stocks at 10 year high on Monthly candles:
https://chartink.com/screener/stocks-at-10-year-high
sir i want to watch live gap in stocks and i want to daily trade for short term in that stocks near life time high
hello sir , my name is satnam singh and i want to make a screener near life time high ( 1% to 20% gap ) stocks , please help me
Sure, below is an example scan:
https://chartink.com/screener/stocks-whose-latest-close-is-within-15-of-it-s-52-week-high-and-ema-greater-than-50
Dear Sir,
Can we have a scanner for a condition where a Renko brick changes from Red brick to Green brick. (Renko 1 ATR).
Also when one Green Brick is formed.
Currently we do not support Renko charts. We do plan on adding it in the near term.
Sir,
I am unable to create Bracket(Bracket combination just like how one of the intelligent persons has used it here – https://chartink.com/screener/stocks-above-resistance-level-r1-r2-r3
Unable to get Bracket(Bracket working).
Additionally, is there a feature to copy-paste a line (conditional expression) and modify (say everything is same except close and open but I have to re-write the whole expression)?
I am trying to model :
All futures/NIFTY 50 where
Today’s high = ((2*(prev day high + prev day low + prev day close)/3)) – prev high)
Any guidance?
Something went wrong with Greater than symbol – here is the actual scanner I was trying to build
Today’s high LOWER_THAN_EQUAL_TO ((2*(prev day high + prev day low + prev day close)/3)) – prev low) AND
Today’s low GREATER_THAN_EQUAL_TO ((2*(prev day high + prev day low + prev day close)/3)) – prev high)
Any guidance on how to create Bracket(Bracket ??
Sir I think I got it. It was a bit un-intuitive but I got it. Thanks much – I am going to try it.
Are you looking for scans on pivot points? Below are few:
https://chartink.com/screener/stock-crosses-above-pivot-point-resistance-1-open-equals-high
https://chartink.com/screener/stock-crosses-above-pivot-point-r2-and-open-equals-high
https://chartink.com/screener/stock-crosses-below-pivot-point-support-2-5-min
https://chartink.com/screener/support-1-pivot-point
https://chartink.com/screener/copy-stock-crosses-above-fibonacci-pivot-point-resistance-3-1
https://chartink.com/screener/stock-crosses-below-fibonacci-pivot-point-support-3-1
hi akash..
can i scan ask & bid qty with chartink.. how it possible
Hello,
Currently we do not have this feature.
sir
i feel great with your services .
can we back-test any given scanner in your list with back days data as like that in this form easy to understand how much this scanner is good for day trading
i want to do it for _____ Open = high 1000% sure sell _______
date – time -rate – buy or sell- quantity- gain or loss final result of month end + or – net
Hello,
Yes, you can back-test scans.
Hope this helps on back-testing:
https://chartink.com/articles/?s=back
It will show the previous days/ minutes results for your scan without the need for you to modify the scan. Back-testing will not give alerts. It is only to analyze/ view stocks previously triggered by your scans. If you click on any of the bars on the graph, it will show the list of stocks that triggered as per the scan previously.
Back-test data will show data for the lowest candle time frame in your scan. If lowest time frame is 1 minute, it will show results for last 1 minutes. If its on daily candle it will show data for past 6 months. We show results for the past 150 bars in our backtest section, these 150 candles could be of any timeframe, depending on the lowest timeframe in your scan, so for 5 minutes for example, you would get 2 days, for 1 minute, half a day and so on.
If you have the alert frequency of 5 minutes on a 1 hour candle scan, the alert results will update every 5 minutes and so will the backtest results(if you open the site and view the graph every 5 minutes), the difference is that the alert keeps a history of all your stocks triggered every 5 minutes i.e at 9:20am, 9:25am and so on via the alert history page,, whereas the backtest graph doesn’t keep any history as such, it will show the results only as of the candle completion time i.e 10:15am. so its not necessary that the backtest will show all the stocks that were triggered every 5 minutes as your alert show’s.
Alerts is a premium feature that would allow you to do this, it keeps a track of all your stocks that met the condition every 5 minutes so that you don’t need to keep a track of them manually in the scanner page or the backtesting graph. The backtest is a dynamic graph that would update/change as your 1 hour candle is changing.
Great!
Can you please provide a slider or something similar so that we can back test for another set of 150 candles – Previous days, weeks, months, etc.
We do plan on increasing this time frame in the near term. Shall keep you posted.
Any way to record signals generated with time and price?
Hello,
Do you want to see the triggered time of the alert?
If yes, you can see by clicking on the scan name here: https://chartink.com/alert_dashboard
Hi,
I need following scanners.
1) 5 Min Heikinashi candle closes above and below 10 SMA. In both cases how to create scan and how to get alert for only Banknifty futures? Not interested in other stocks.
2) Heikinashi candle color change alert e.g. I should get alert on formation second red candle if two consecutive red candles appear after a streak of green candles.
Please tell me how to create these custom scan only for Banknifty futures and how to set alerts in premium subscription.
Thank you
Sure, these are possible. We did receive your email and have replied to the email.
Hello
Can you please share the details with me also.
I want to create an screener of Heikinashi candle color change alert e.g. I should get alert on formation first green candle (day) appear after a streak of red candles.
Will previous 10 candles red and current green help?
Can we have Charts on Mc Ginley Dynamic and Stoch RSI (Trading view setting) ?
Currently we do not have this indicator. We may plan on adding it in the near term. Shall keep you posted.
Sir, I am premium user. I want following scan. pl mail me.
(a) Bollinger band 30, 1.5
(b) Awesome Oscillator – default
(c) RSI – 7
(d) Super trend – 7, 1.5
with 15 Min Time Frame.
Hello,
Currently we do not have Awesome oscillator. We can have a scan created with the rest. Please email your requirements to [email protected]
In premium subscription we get tips or analysis plz get me know
Hello,
We do not recommend stocks, we only provide with charts and scans.
As a premium member you would be able to:
Access realtime data for Charts & Scans every minute
Create Alerts and receive updates of stock breakouts over sms/email/mobile/desktop
View charts in 1/2/3 minute timeframes with auto-refresh
Run screeners in 1/2/3 minute timeframes with auto-refresh
Scan any watchlist via the segment dropdown of a scan
Customized dashboards for market overview
Get Dedicated support for your scanner requirements
You can get details/signup our premium service here: https://chartink.com/subscription
which is the best script for shooting star and hammer in 5 min 15 min 1 hour time frame as i were subscribed in chartink for 1 month but no result came out
Below are scans for the same:
https://chartink.com/screener/shooting-star-bearish-sell-15-min-previous-candle-bullish
https://chartink.com/screener/shooting-star-bearish-sell-5-min
https://chartink.com/screener/intraday-1-min-pin-bar-bearish-shooting-star
https://chartink.com/screener/bullish-hammer-5-minute
https://chartink.com/screener/bullish-hammer-15-min-previous-candle-bearish
https://chartink.com/screener/bullish-hammer-1-hour
How do i apply a strategy on my watchlist?
Hello,
You can run scans on a watchlist. You may select the same from the drop down menu. Currently running scans on a watchlist is a premium membership feature.
What will be settings in ChartInk for the Stochastic (4,1,1) setting in trading view?
Please help.
If you can view the formulea of the same, I guess it might be SMI, you can try applying the default i.e 4,1,1,1 on the other platform.
Hi, how to write the code for Moving Average on Rsi and Stochastics, MFI
code is : if (MFI(16) > 50) AND (MFI(16) > Mov(MFI(16),4,E)
here Mov= Moving Average , 4 , EMa
Thanks,
Tapan
Hello,
Below is an example scan for EMA of RSI:
https://chartink.com/screener/copy-indices-scan
Thank you very much.
Most welcome
Ema
Modify measure/value
(rsi(14),30) in this which ema crossing ? i am confuse
Ema is 30.
Presently most of the indicators have close as parameter.ex Bollinger bands, rsi etc which makes difficult to set indicator scan for other parameters. For example it is not possible to set Bollinger bands for macd indicator. As a result we can not scan stocks whose macd line crossing above it’s upper Bollinger band. Please look into it and set other parameters in addition to close prices so that we can set indicator for other indicators and create scan formulae for the same
Hello,
Currently we do not have this feature. We may plan on adding it in the near term. Shall keep you posted.
can you help me find stock which has not crossed from above 100 EMA to 200 EMA since 10 year. like bergerpaint. this stock has not given crossover since 2008. please help me with the formula.
The below scan will do.. I have given for 1000 days which is approximately 4 years.It looks like they dont have historical data beyond 5 years in chart ink. when i analysed among futures Lupin is the only result. hope it helps
https://chartink.com/screener/history
Yes, you are correct. We support upto 4 years on the Daily timeframe, upto 20 years on Weekly and Monthly timeframes
Hello,
Currently such a scan is not possible.
Hi,
How can I find stocks with Daily volatality exceeding 3% and corresponding annual/monthly volatality figures for these stocks?
Hello,
By Daily volatility are you looking for any indicator or stocks gaining/ losing more than 3%?
Hello,
How can I apply filter for my watchlist. I have made a list of particular stocks and I want to filter them but there is no option to add my watchlist. Please help for the same.
you need to be premium member for this
Hello,
I am using Max 52 week high and min 52 week low functions in my scanner. It seems that stocks don’t get filtered which are not year old. Seems that you query explicitly looks for these values. Meaning if stock is just 2 month old, then automatically 52 week high should be set to highest value from last 2 month.
Could you please look into this issue? Sample for these are like METROPOLIS, MSTCLTD.
Thanks in Advance.
Yes, Since we are checking for 252 days in the scan, stocks which have not traded for more than 252 days will not show up.
Thank you very much for response.
Just like https://www.nseindia.com/live_market/dynaContent/live_watch/get_quote/GetQuote.jsp?symbol=METROPOLIS&illiquid=0&smeFlag=0&itpFlag=0 website shows 52 week high / low values even though METROPOLIS haven’t completed 1 year.
I request you to update your logic and make these available so that users can use these values in their screeners.
Looking forward to your response.
Sure, shall get with the team on the same and see if there is a way out.
Thank you very much. Appreciate the efforts.
How to choose the 15min or 30 min time frame for the scanner?
You can select the same from the drop down menu. You need to click on “latest”
[0] 1 hourRsi(15)Greater than equal to[0] 1 hourRsi(13)
[0] 1 hourRsi(14)Less than equal toNUMBER35
[0] 1 hourCloseGreater than[-1] 1 hourOpen
[0] 1 hourVolumeGreater than[0] 1 hourSma(volume,100)*NUMBER2
Can’t find backtest results.
Also if you can help me get max volume in the last 100 candles, if it passes should come in my scan. Something like latest volume > max (volume, 100)
You need current volume greater than avg of previous 100 candles by 200%?
Hi – Did you guys make this filter?
current volume greater than avg of previous n candles / days / months volume?
Below is an example scan for the same: https://chartink.com/screener/today-s-volumes-are-higher-than-average-of-last-30-days-volumes
Thanks for sharing the post. The way you narrated the post is good and understanding. After reading this post I learned a lot of new things about scanner. Please let me know for the upcoming posts.
Nice to hear that. Sure, shall keep you posted.
Hello Sir,
I need to apply filters on Nifty 100 Stocks alone while scanning and May I know the filter to be used to scan these specific stocks
Hello,
Sure, you can select “Nifty100” from the drop down menu. You need to click on “cash” and select Nifty100.
hello,
5m supertrend crossed below 5m close greaterthan previous 5m supertrend crossed below 5m close
how can apply filter for this
Hello,
Below is a scan for close crossed above super-trend – 5 min:
https://chartink.com/screener/5-minutes-close-crossed-above-supertrend
hello,
(1)latest 5m supertrend crossed below 5m close, greaterthan (2)previous 5m supertrend crossed below 5m close
how can apply filter for this
Hello, Currently such a scan is not possible. We can scan for current 5 minute candle crossing above supertrend: https://chartink.com/screener/5-min-supertrend-crossed-below-close
HOW TO PLACE BRACKET
Hello,
Once you open the scan page, click on the funnel and select “bracket” from the drop down menu.
sir, want scanner for 1st 15 minute candle not crosses high and low by 2nd 15 minute, 3rd 15 minute and 4th 15 minute candle upto 1015am
You need 4 candles upto 10.15 am to not cross days first 15 min high/ low?
yes sir
Below is your scan:
https://chartink.com/screener/3-candles-upto-10-15-am-to-not-cross-days-first-15-min-high-low
HI Sir
i am looking for ADX with 50,14 values, but when i tried its showing empty results.
if ur able to add those facility its good to catch strong trend
Below is a scan on ADX greater than 50:
https://chartink.com/screener/adx-greater-than-50-5
Hi. Could you please help me getting a scanner for stocks given Positive results from Negative results on QoQ and YoY basis
sir,
want scanner for 1st day- first 15 minute High-Low break by whole day any candle, 2nd day – first whole day High-Low not break
Below is your scan:
https://chartink.com/screener/scan-for-pravin
You will need to run this at end of day
Dear Sir,
When I put Futures in a scanner, the Nifty & Banknifty future do not comes in results. Any specific reasons?? Please reply.
Hello,
It will scan for all stocks in F&O. For Indices, you may create a copy of the scan and run it against indices.
Currently we support only NSE cash stocks and indices. We do plan on adding others in the future. Shall keep you posted.
We have added a segment filter that can be modified in the top-most filter that scans stocks that are in the F&O segment
Sir mai hindi language student hu….mai charting sikhna chahta hu…plz help me…9532801814 my mobile numbar
You may view tutorials on scans and alerts here:
https://chartink.com/articles/scanner/scanner-user-guide/
https://chartink.com/articles/alerts/alerts-guide/
https://chartink.com/articles/alerts/desktop-mobile-a-k-a-web-notifications/
You can also start by reviewing out top scans here: https://chartink.com/screeners/top-loved-screeners
They contain the top 10 scans used for Intraday/Swing & short term trading
Sir mai charting sikhna chahta hu….hindi language student hu
Hello,
You may view tutorials on scans and alerts here:
https://chartink.com/articles/scanner/scanner-user-guide/
https://chartink.com/articles/alerts/alerts-guide/
https://chartink.com/articles/alerts/desktop-mobile-a-k-a-web-notifications/
You can also start by reviewing out top scans here: https://chartink.com/screeners/top-loved-screeners
They contain the top 10 scans used for Intraday/Swing & short term trading
If you need help in creating a scan, please share your requirements, we shall create the same for you.
If you have any other queries/feedback, please feel free to contact us.
Min/Max functions ignore stocks if total number of stock period is less than given ‘periods’. For eg. Max(30, high) > 500 will missed stock like ‘SBICards’ which has only 4 day total period. There should be an option to include this or not in Min/Max function.
Hello,
Yes, currently scan will check only for stocks that have the said number of days data. Shall get with the team on the same.
Hello ,
I want to create a scanner which will tell the day high of the stock in 15 min timeframe.. example…
previous high of 15min candle is day high and latest 15 min candle high is lower than previous candle high…
Sure, below is your scan:
https://chartink.com/screener/scan-for-jogesh
I want to filter my results for specific Sectors (like IT, Automobile, FMCG etc). How do I use Sector as filter criteria?
We do plan on adding segments for these in coming days so one can scan for a particular sector only. For now, you may create a watchlist and run scans against the same.
Hello Guys,
Is it implemented yet?
Hello,
This is still in the process of getting done. However, you can check this on the Atlas dashboards now. Here is a sample dashboard link:
https://chartink.com/dashboard/65860
Sir I want to learn charting how do I start,pls advise…
You may view tutorials on scans and alerts here:
https://chartink.com/articles/scanner/scanner-user-guide/
To set alerts for a scan, you need to click on “create alert” after opening the scan page and set your alert preferences accordingly.
https://chartink.com/articles/alerts/alerts-guide/
https://chartink.com/articles/alerts/desktop-mobile-a-k-a-web-notifications/
https://chartink.com/articles/alerts/webhook-support-for-alerts/
You can also start by reviewing out top scans here: https://chartink.com/screeners/top-loved-screeners
They contain the top 10 scans used for Intraday/Swing & short term trading
If you need help in creating a scan, please share your requirements, we shall create the same for you.
I need to get the list of stock that satisfy the critieria below:
Openining candle has a range of 1-1.2%. ie. Price difference between the lowest and the higest of opening candle.
Days second candle high is higher than the first and second candles lower is higer than the first candle lower
Days third candle high is higher than the second and thrid candles lower is higer than the second candle lower
Hello,
We did see your email and shared the scans.
I Want to create a scan based on Heikin Ashi candle with below criteria.
Time frame 1 day
Segment- Futures
Day 1- Doji
Day 2 – Open equal to Low/ High
Day 3- Break the high/Low of day 2
Can anyone help me out with this.
Thank you
Below is your scan:
https://chartink.com/screener/day-1-doji-day-2-open-equal-to-low-high-day-3-break-the-high-low-of-day-2
Dear Chart Ink Team,
its really really a wonderful platform for a lot of time saving!!!
required your help to scan following scenarios-
1- Today’s Hourly Time frame (out of total 7 candles) – “Morning Star” & “Evening Star candle”.
2- Today’s 15 Minute Time Frame (out of total 28 candles)- “Morning Star” & “Evening Star candle”.
3- Today’s 5 Minute Time Frame (out of total 84 candles)- “Morning Star” & “Evening Star candle”.
Thank you, Team chart ink.
Hello,
You need a dashboard which displays number of times morning start/ evening star pattern was formed in previous ‘n’ number of candles?
What is “Dashboard”?
Atlas dashboards give an overall view of your scans and the markets. Below are a couple of example dashboards. We do plan on adding tutoiral for the same in the near term:
https://chartink.com/dashboard/4
https://chartink.com/dashboard/690
https://chartink.com/dashboard/6
Hi Sir,
Please help to understand the difference between cash, Futures, Indices in segment filter.
Hello,
Currently we support only NSE cash stocks and indices. We do plan on adding others in the future. Shall keep you posted.
Futures is only a group created for stocks that are in F&O segment. Scanning is done on cash prices only. Indices will run scans on all idicies on NSE (e.g. nifty, bank nifty, nifty pharma, etc.. )
Could you please provide scanners for below:
I want to screen Mid caps and large caps.
1. Request to provide chart that shows 3 consequitive fall candles. This should scan three consequtive falls say days open candle, 2nd and third 5 min candle.
(5mins candle)2nd candle high should be less than first candle high and its low should be less than first candle low.
(5mins candle)3rd candle high should be less than second candle high and its low should be less than second candle low.
Req 2:
Opens positive with diffence between days first candle high and low to be in 1-1.5% range
Second candle low to be higer than first candle low
Third candle low to be higer than first candle low
TIA
Hello,
We did see your email and shared the scans.
How to create scan for price hovering near vwap,likely to cross above it on next 1-2 days.
N price crossed over vwap in 5 min and 15 min time frame
Below are a couple of example scans for the same:
https://chartink.com/screener/close-price-that-is-less-than-vwap-by-0-03
https://chartink.com/screener/30-min-open-and-close-above-vwap
pl. explain Fibonacci Retracement in details.
Hope this link helps: https://www.investopedia.com/terms/f/fibonacciretracement.asp
is there any way to compare current time candle with very first candle of the day?
Sure, you need opening range breakout?
kindly add column of industry & sector along with stock names in result of screeners . so we can identify trending sectors.
This is possible on Atlas dashboards. You may copy a scan there by clicking on “Monitor on Dashboard”. Below is an example dashboard: https://chartink.com/dashboard/4
How to stop auto refresh? I need to screen many charts in one the of filters but screens get refreshed automatically before I’m even done looking at all the charts.
Hello,
On charts one can un-check the auto-refresh box on top right hand side of the chart. This will stop the same from auto-refreshing.
Not the charts. I’m asking about scans. The scans automatically get refreshed every minute, before I’m done looking at the stocks. How to stop auto refresh in scans? There isn’t a button to stop it like in charts.
Currently we do not have the feature to stop the same. If you have created alert for the scan, you may view list of stocks triggered along with the time stamp here: https://chartink.com/alert_dashboard
Hi Team,
Is there a way to find out the breakage current low with lower lows – at least 3 low break out – Example refer to daily chat of PEL which broke out 3 lows (12-May-2020).
It broke 24-Apr(805.8), 26-Apr(808.1) and 06-May (857.3)
12-May-2020 low is 802.3
Regards
Madhu
Hello,
We can check if a stock has broken its previous 15-30 or any other number of candles low. Will this work?
Is there a way to not to show NIFTY 50 stocks when we select all Future segments in filter. I dont want to see NIFTY 50 stocks. is it possible?
Hello,
Currently only way to do this would be to create a watchlist with the rest of the stocks and run the scan against the watchlist.
Sir,
I just want to thank the ChartInk Team for your efforts in providing one of the best free technical scanners in India with simple and easy to use interfaces for scripting. For a beginner like me with zero experience and low capital, this free platform is a huge life-saver not just for screening but for learning purposes too.
I was able to understand and create custom screeners with much ease with your simple language-based script.
The free tools you provide here are much better than those paid-ones & subscriptions provided by most Indian brokers.
I will surely opt for the Premium subscription in the near future not just because there are better facilities in there but also because you have helped a beginner like me by providing great tools for free.
Thank You ChartInk.
-Yanger, Nagaland.
Hello,
Thank you for your kind comments. Glad you are enjoying it
Respected Sir, i am very impress after visit chartink website. i recently join. i also want to take premium membership. i have a little question.
sir, if i want 3day ema crossover 13 days ema, on the spot, which minute 3day ema cross 13 days ema, at that minute i want to alert. not on EOD closing basic. for that which type of condition i have to creat, thanks.
Below is your scan for 3 min time frame:
https://chartink.com/screener/3-min-ema-5-crosses-above-ema-13
Respected Sir,
i am your premium member.
i have a little query.
when i type EMA Condition it shown as under .
1. — [0]15 minute Ema ( [0] 15 minute Close ,10 ) crossed_above [0] 15 minute Ema ( [0] 15 minute Close , 20 )
but in readymade scanner i found is as under
2.— [0] 15 minute Ema ( close,10 ) crossed_above [0] 15 minute Ema ( close,20 )
i know readymade scanner is right. but why i cannot remove — [0]15 minute —- from Ema ([0]15minute close,10) i try to remove [0]15minute and keep only close word but after many try i cannot do please guide me. thanks
Hello,
Yes, both are fine. The below is also good to go and will give accurate results. It is due to the recently upgraded version of the scanner:
[0]15 minute Ema ( [0] 15 minute Close ,10 ) crossed_above [0] 15 minute Ema ( [0] 15 minute Close , 20 )
i want to find out stocks which are crossing 5 day sma. how to write it.
Sure, below is your scan:
https://chartink.com/screener/close-crossed-above-sma-5-1
Hi,
This is great website ! However, can u pls add candlestick sreener for multiple time frames like 5 mins , 10 mins, 15 mins and so on….
Sure, you may choose the time frames as per your choice from the drop down menu in our scans.
Respected Sir,
if i want only those stock which circuit limit is 20%, i don’t want to know how much % stock up or down, i only want to know which circuit limit is 20% and i create a scan those stock with other condition, stock maximum circuit limit is 20%, please guide………… Thanks
Hello,
Currently such a scan is not possible. We can check for stocks gaining more than 19% for stocks which are about to hit the circuit.
Hi Team, I can see there are some indicator provides this type of functionality, why can’t you able to implement for example exclude 5% circuit stocks
Hello,
We have created the scan. Kindly review.
https://chartink.com/screener/excluding-the-5-upper-circuit-stocks
Note: We don’t have the feature for the circuits; however, this can be partially achieved with the help of the % change field.
Hi Team, I see that now backtest section is only showing 8-9 months data for monthly scans also? Also download backtest data is repeating for every day of month, instead of showing one entry like previous.
Please check and reply
Hey, I want following scanner
Day’s first 15 minute candle high and low is greater than next three 15 minute candle high and low.
Below is your scan:
https://chartink.com/screener/day-s-first-15-minute-candle-high-and-low-is-greater-than-next-three-15-minute-candle-high-and-low
Hi
Is there any screener available for stocks nearing 8 SMA line.
Thanks
Below is your scan:
https://chartink.com/screener/stocks-near-within-sma-8-by-0-10
How I use Vwap indicator in Chartink Chart
We do have it in our scans. We plan on adding it to charts in coming days.
Hi,
One of the screeners ( attached in the screenshot ) triggered an alert at 09:20. But the rules in it requires 10 min back data. Can you please help me understand its working
https://chartink.com/screener/test-10-minute-stock-breakouts
Hello,
Have you set alerts to run every 5 minutes? in this case, scan will check for stocks on the incomplete 10 min candle and send alerts.
I am unable to find indices option scanner i.efo nifty n bank nifty options trading.
Currently we support only NSE cash stocks and indices. We do plan on adding others in the future. Shall keep you posted.
Why is Open interest and derivatives data not yet incorporated on the platform? I would bring the whole functionality to a new level and cause a surge in customers for you. request you to work on this in priority over anything else.
Currently we support only NSE cash stocks and indices. We do plan on adding others in the future. Shall keep you posted.
Just wanted one quick clarification. When i see a timestamp in the backtesting area, does that timestamp refer to the start of candle time or end of candle time ? For example, for a 5 min scan, if some stock comes out at 9:40, does it mean end of the 9:40 candle ?
The confusion arises as the timestamp on the charts is of the start of the candle. While the timestamp mentioned in the back-testing window is end of candle ( my assumption )
If both were in sync, it would be less confusing.
Yes, on the backtest too, its the start time of the candle i.e 9:40am(9:40:00am to 9:44:59am) and so on..
Is there “AND” function ?
if we want to compare a price between 25 to 100 ?
I typically use two conditions which I am sure you do too. Price above 25 and Price below 100.
Yes. We can add 2 queries as Konal suggested. Close greater than number 25 and close less than number 100
Hello…I wish to set the query for below, kindly help
Todays opening 5 min candle is greater than previous days 5 min last candle.
[=1] 5 minute Open > [=-1] 5 minute Close
I hope that this will help
Below is your scan:
https://chartink.com/screener/todays-opening-5-min-candle-is-greater-than-previous-days-5-min-last-candle
Do we currently have a feature, or can we add a feature, where I can create a scan using other scans as conditions ?
Example :
Scan A : Overbought
Scan B : NR7
Scan C : Scan A and Scan B
Would make a lot of scans much cleaner.
Hello,
We can create a scan using sub-filters where we can add scan conditions for A &B and if any of the 2 conditions match, scan would give the results.
I meant, all scans, A and B are a set of multiple conditions themselves … and can we using the scan Id or link of A and B in scan C.
But I do understand that this could be technically unfeasible.
Thanks !
Hello,
Currently we do not have this feature. We may plan on adding it in the near term. Shall keep you posted.
Is it somehow possible to use Relative Strength ( RS ) in the scans ? I see we have RSI as an indicator but not RS.
RS = Price of stock / Price of some index ( Nifty, Nifty 500, etc.) ?
Thanks !
Hello,
Currently we do not have this feature. We do plan on adding it in the near term. Shall keep you posted.
Relative Strength feature will be a great addtion to your platform. Will wait for this feature to be introduced.
Hi, have you added this feature
Hi,
Thanks for the good work..!
In Screener, is it possible to get the list of stocks where RSI(14) is below 30 for certain period. e.g., RSI(14) is below 30 for last 20 days or last 20 sessions?
How to write this filter?
Thanks in advance.
This might work. Though I am not an expert and there could be better ways.
https://chartink.com/screener/public-scans
There was a slight correction needed, I updated it now: https://chartink.com/screener/public-scans
Below is an example scan for Last 10 candles 15 min – RSI less than 30
https://chartink.com/screener/last-10-candles-15-min-rsi-less-than-30
Hello,
Love the product so far.
Is there a way to get the COUNT of stocks that come in the Backtesting window for any scanner ?
Regards,
Konal
Currently if you move the cursor over the back-test candles it will display count industry wise. Currently we do not have the provision to display total number of stocks
I need to create a scanner where the closing price is above the Central line of default Bollinger Bands. What should i use ?
Please ignore the above. I have used price greater than EMA(20) to achieve the same. Thanks !
Hello,
Yes, middle bollinger band is SMA 20. You may use the same.
Hi there,
How can I create wide and narrow cpr scanner for Nasdaq market stocks
Hello,
Currently we support only NSE cash stocks and indices. We do plan on adding others in the future. Shall keep you posted.
Hello,
Do you have a estimated time for when the US Markets will be available to scan ?
Probably by this year end.
I have a scanner created i.e. “2nd 15 minute candle is intermediate”.
basically i want to see all the nifty 50 stocks for the day, which has 2nd 15 minute candle intermediate to 1st 15 minute candle of the day.
But the scanner which i created gives me data for current day only, and i want to backtest it for past days also.
Currently back-test can go back only upto previous 150 candles (any time frame). We do plan on adding more features to the same in near term. This would show 6 days data in back-test for now.
Hello Team,
I have a scan using all Latest values – high, close, EMA(20), etc. The results for this usually comes after the close of the market.
Is there a way i can get the result before 3:30 ? If you can give me possible approaches i will build it. Do not need a scan.
One approach i thought is to use Last 30 min candle ? is that correct approach ?
Thanks
If a stock matches your criteria during the day, it will show in alerts and send alerts for the same. You may set alerts to run every minute.
HI, How can i get sum of Abs(close – open) of last 5 candle and Sum of (Close-open) of last 5 candle? In first part it is Abs(close-open) and in second part it is (Close-Open). Please Help#
Hello,
Can we filter or scan stocks based on their Beta value ? If yes, which parameter should be used.
Thanks,
Konal
Hello,
Currently we do not have this feature.
Hi All,
I am trying to obtain consolidated sum of volume of 5min candles and check if the volume at the moment of the day has crossed over 1 Million or not.
This is what I have done so far:
[0] 5 minute Sum ( [0] 5 minute Volume , 75 ) >= 1000000
The problem is that the data from previous day is also getting picked by the filter.
Is there a way I can applying some kind of group by operation on date or restrict the above filter to pick data the from current day only.
Any help would be greatly appreciated.
Thanks,
Akhil
Hello,
No, currently this is not possible. We do plan on adding this feature in the near term. We can use “latest” and check if its total volume has crosses 1000000
In my scans, I am getting ETFs also. Is there any way that I can get only stocks and not any other things ?
My scan is giving me given below output
Stock Name
Just Dial Limited
Jb Chemicals & Pharmaceuticals Limited
Adani Power Limited
CNXNIFTYJUNIOR
Nhpc Limited
LIQUIDBEES
Sjvn Limited
I dont want CNXNIFTYJUNIOR and LIQUIDBEES in scans .
Hello,
Under segment “Cash” all stocks/ eft’s listed on NSE are filtered out. You may try using “Nifty500” to avoid these.
I would like to filter as follows in Chartink scanner – can you help me with it.. I have subscription under [email protected]..
EMA 9/EMA 26/EMA 50 difference of all these EMA in price is between 0.5% to 1%.. Can I filter like this in the Chartink Scanner? If yes, can I receive the codding of same?
Hello,
I believe we had received your email and have shared the same with you.
Can we make a screener with Multiple timeframes. Eg. First scan is on Monthly timeframe. Then the scan results are further scanned for Weekly Timeframe. Then the scan results are further scanned for Daily Timeframe.
Hello,
Yes, we can add all these conditions in one scan and results will display once all conditions are satisfied.
How to create a script which checks, if the first 15 min candle high and low are within 1-2% of the total value of that stock. I tried to write it, but its not working properly.
Below is a scan for the same:
https://chartink.com/screener/range-high-low-of-a-candle-2-of-ltp
hello sir
im looking for a scan LTP above yesterday high can you help with that ?
Sure, below is your scan:
https://chartink.com/screener/current-close-greater-than-1-day-a-go-high
Hi , I want a scan according to candlestick size…
On 1 min chart, if latest candle body size is greater (green or red) in size than average of previous 20 candle size.
Below is your scan:
https://chartink.com/screener/candle-body-size-is-greater-green-or-red-in-size-than-average-of-previous-20-candles
I want to create a screener showing stocks whose 50 day return crosses nifty 50 day return.
Unable to add nifty symbol in the screener.
For example screener should be like
(Symbol: Nifty ( latest close – 50 days ago close ) / 50 days ago close = X) )
Screen from whole cash segment ( latest close – 50 days ago close ) / 50 days ago close crosses above X
Hello,
Currently we do not have this feature. We do plan on adding it in the near term. Shall keep you posted.
Please add Nifty symbol. You telling we do plan on adding NIFTY symbol since 2019. Still you are unable to add NIFTY symbol.
Are you referring to the scans?
Is this feature added I want to add condition on index please help/guide.
Hello,
We can add the relative strength scan for the specific conditions. Can you please share your requirements to this email ID: [email protected]
Hello Sir,
Thanks a lot for providing wonder full platforms and scanner.
Can you please help with the scanner for below condition.
Current week volume is greater than 10 times of life time weekly average volume.
Lifetime may be 100 weeks or 200weeks or 500 weeks or 1000 weeks.
Much appreciate your help.
Thanks,
Saravana
We need to enter previous “n” of candles for the scan to go back and check for. Would 100 or 200 weeks be fine?
IT IS VERY HELPFUL SITE FOR TRADERS.
I JUST WANT TO KNOW THAT HOW CAN I ADD” INDUSTRY PE” IN SCREENER
W do plan on upgrading our fundamental data in a couple of months. Shall keep you posted.
How to add “Sector PE” in screener
We do plan on upgrading our fundamental data in a couple of months. Shall keep you posted.
Sir, help me with a scanner to find
1) High of past 21 days
2) Low of past 21 days.
Not clear with Max(), Min() functions here.
Thanks in advance.
Below are your scans:
https://chartink.com/screener/stocks-at-21-day-high
https://chartink.com/screener/stocks-at-21-day-low
Sir, help me with a scanner to find
today’s daily candle should not retrace more than 66% or 2/3rd of yesterdays candle
example :
suppose
1) yesterday candle was bearish candle
2) today’s candle is bullish candle
3) today’s daily candle should not retrace more than 66% or 2/3rd of yesterdays candle
Below is your scan:
https://chartink.com/screener/fibonacci-bounce-from-66-retracement-from-1-day-ago-levels
Team,
Is there a difference in a trigger firing if I use one of the below conditions :
– Latest Close Greater than EMA20
Versus
– [0] 5 minute Close Greater than EMA20
In the second case, will the trigger fire the moment price is greater than ema20 or will that happen once the 5 min candle is complete ?
Thanks !
Hello,
Yes, Latest candle refers to daily candle. 2nd condition is for current 5 min candle crossing above EMA 20. EMA values for both these candles will be different.
Need a scan which can tell if stock is above its Weekly Pivot.
Problem am facing is weekly Pivots are calculated based on previous years high low and close. Am not sure how to get last year high low and close.
Hello,
Below is your scan:
https://chartink.com/screener/close-greater-than-weekly-pivot-point
Thanks, But thats not what am looking for.
Its calculating based on Previous Month high low and close.
What I am looking for is Pivot calculated based on Previous Year High/low and close.
Below is a scan for the same:
https://chartink.com/screener/close-crossed-above-yearly-pivot-point-resistance-1
Sir i am looking for the link- CLOSE GREATER THAN PRICE VOLUME TREND , but i am unable to get the result in SCREENER search. Please help me to find the formula. thank you . “CHARTINK HELPED ME A LOT”, but I try to pull out strong fundamental parameters like ‘ PE RATIO , PB ,PEG, ROE, ROCE, DEBT TO EQUITY, GRAHAM NUMBER,INTRINSIC VALUE,PRICE TO SALES, PROMOTOR HOLDING /PLEDGING etc,. but i unable to find these short forms, please help me to search above parameters.
Hello,
Below is a scan on PVT (price volume trend):
https://chartink.com/screener/close-greater-than-price-volume-trend
We do plan on upgrading our fundamental data in a couple of months. It will have all these indicators.
Good evening sir, Help me to find a scanner for stocks closing near 38.2% or 50% or 61.8% or 78.6% retracement from 52weeks high. Thank you.
Below is an example scan for the same:
https://chartink.com/screener/fibonacci-retracement-screener-yearly-50
Thank you very much for your quick response and support Sir.
most welcome.
Hi ,
Is the High Beta Stocks filter working as desired in a scan ? I do not get any result when a run a scan with that applied.
Thanks !
Currently we do not have this indicator. We do plan on adding it in the near term.
Good evening sir, please help me to find a screener — ” increase in price , volume , open interest” Bullish strategy. Thank you.
Hello,
Currently open interest is not possible as currently we support only NSE cash stocks. We have only created a segment group called ‘futures’ to scan stocks that are traded in the F&O group. If you select futures, scanning will be done on basis of cash stock prices/ values.
Scan on other 2 are possible.
Dear Team, how to create a scan , within no of days , for example to find ” with in last 10 day open , high same ” and any day break high , kindly help
Below is an example scan for current price greater than 10 day high:
https://chartink.com/screener/current-close-greater-than-10-days-high
What will be settings in ChartInk for finding the Stochastic (5,4,3) crossover (period-5, %k-4, %d- 3)
Please help.
Hello,
It seems like smoothed slow stockhastic %K. You may use the same within an EMA in our scans. Below is a screenshot for the same:
Latest Ema ( Latest Slow Stochastic %K ( 5 , 4 ) , 3 )
Dear team,
Im a intraday trader doing only futures. I always work with 5 minute candle. Do not know what scanner has to be used. plz help me out two best scanners. one for bullish and the other for bearish
You can start by reviewing out top scans here: https://chartink.com/screeners/top-loved-screeners
They contain the top 10 scans used for Intraday/Swing & short term trading. These are sorted by most loved by members.
Latest close should less than 3% of last 40 candell low. Please make the scanner on this condition.
Below is your scan:
https://chartink.com/screener/latest-close-should-less-than-3-of-last-40-candel-low
thank your very much sir
Most welcome
Dear Sir
latest close should be less thane 10% of latest low
kindly make the scanner for us
You need current price less than 10% from previous day low?
Good afternoon sir, how to scan narrow CPR stocks . thank you .
Hello,
Below is an example scan for the same:
https://chartink.com/screener/cpr-narrow-within-1-of-tc-and-bc
Dear Sir
latest close should be less thane 10% of latest low. (Like Lower low)
kindly make the scanner for us
Let me know if the below scan helps:
https://chartink.com/screener/latest-close-should-be-less-thane-10-of-5-day-ago-low-like-lower-low
Good evening sir, I would like to scan certain indicator on a time frame. For example I would like to scan RSI above 70 on weekly basis
RSI above 70 on Monthly basis
RSI above on daily basis.
While all other parameters are able to put I am not able to put time frame i.e. Weekly or Monthly or so on. Please guide
Below is an example scan for the same:
https://chartink.com/screener/rsi-above-70-on-weekly-basis-rsi-above-70-on-monthly-daily-basis
This scanner is built on multi timeframe but it only gives correct result in backtest how will its condistions match in live?
Hello,
Thank you for reaching out. The reason you see this is that your scan is using the weekly and monthly timeframes, and you are running the scan in between the week/month. This will cause the scan to show you results based on an incomplete weekly/monthly candle. The results in the backtest will continue to repaint/update until the weekly and monthly candle completes its formation. I hope this helps.
You may ignore backtest results for this scan as it is not always accurate due to multiple time frame candles used in the scan; this is because the backtest uses a higher timeframe candle that would spread for all bars within the backtested history, so as long as the higher timeframe candle is incomplete, all bars in the backtest would too change/update.
In contrast, the alerts you receive for this scan are accurate and sent instantly once any stock matches all scan criteria.
Dear sir, Good day to u.
Please help I want to create scan :::
1. GCO BUY STRATEGY :::
5 MINUTE EMA ( CLOSE 14 ) CROSSED ABOVE 5 MINUTE EMA ( CLOSE 206 ) .
2. GCO SELL STRATEGY :::
5 MINUTE EMA ( CLOSE 14 ) CROSSED BELOW 5 MINUTE EMA ( CLOSE 206 ) .
WILLING TO SUBSCRIBE VERY SOON SIR.
THANKS.
Below are your scans:
https://chartink.com/screener/gco-buy-strategy
https://chartink.com/screener/gco-sell-strategy
It is more helpful which is you making scan (lower Low ) for us.
Thankn you so much sir
Below are a couple of example scans for the same. Let me know if you any further help:
https://chartink.com/screener/7-lower-lows-and-red-candles-daily-candles
https://chartink.com/screener/3-lower-lows-15-min
Dear sir, Good day to u.
Please help I want to create scan :::
1. GCO and VWAP BUY STRATEGY :::
= 5 MINUTE EMA ( CLOSE 13 ) CROSSED ABOVE 5 MINUTE EMA ( CLOSE 206 ) ,
= LATEST VWAP CROSSED ABOVE LATEST EMA (CLOSE,13)
2. GCO and VWAP SELL STRATEGY :::
= 5 MINUTE EMA ( CLOSE 13 ) CROSSED BELOW 5 MINUTE EMA ( CLOSE 206 ) ,
= LATST VWAP CROSSED BELOW LATEST EMA ( CLOSE, 13 )
THANKS. SIR.
GOOD DAY SIR,
PLEASE HELP TO CREATE SCAN FOR THE ABOVE SIR
HELP SIR
DR RAJAN
Hello,
Below is an example a scan for point 1:
https://chartink.com/screener/gco-and-vwap-buy-strategy
This scan and many others are possible. We provide dedicated scanner support only to our premium members which allows you send your scan requirements and we create and share the scan with you. You review examples scans or create your own scan by following our scanner guide here.
Hi Sir,
Could you please let me know, How to create a scanner with below condition.
3 months high> 2 months high> 1 months high
and
3 months low> 2 months low> 1 months low
It would be very helpful if you create it.
Thank you!
(3 months ago high > 2months ago high > 1 months ago high) and (3 months ago low > 2months ago> 1 months ago)
I tried to create it.. however I found that it has multiple comparison error..
Please help Sir!
Below is your scan:
https://chartink.com/screener/scan-for-anurag-sahoo-says
Thank you very much Sir!
Most welcome.
Hello Sir,
I request to design screener for the following conditions .
# price closed above 10 EMA in weekly time frame.
# 30 EMA crossed above 40 EMA in weekly time frame in the same scan.
Below is your scan:
https://chartink.com/screener/price-closed-above-10-ema-in-weekly-time-frame
Hello Sir,
In Bollinger band, the latest candle should be open above the middle line. I need such a scanner. If there is such a scanner, send me the link. Time frame 15 minutes
Hello,
middle band is SMA 20. Below is an example scan for the same:
https://chartink.com/screener/15-min-close-crosses-above-bollinger-middle-band
how and where to use the term “Marketcapname” in the chartink scanner ? please help me understand, thanks
Hello,
Currently this can be plotted/ used only on Atlas dashboards.
Dear Sir,
I wanted to create scanner where ema 4 crosses above ema 20 (weekly),Latest supertrend (10,1) crosses above Ema Close 20 Latest(Daily).Please Guide.
Thanks,
Nishant
Below is your scan:
https://chartink.com/screener/ema-4-crosses-above-ema-20-weekly-latest-supertrend-10-1-crosses-above-ema-close-20
Dear Sir,
I wanted to create scanner where ema 4 crosses above ema 20 (weekly),Latest supertrend (10,1) crosses above Ema Close 20 Latest(Daily). Actually i was able to create that but not able to save.Please guide.
Thanks,
Nishant
Do you see any error message when saving the scan?
Below is your scan:
https://chartink.com/screener/ema-4-crosses-above-ema-20-weekly-latest-supertrend-10-1-crosses-above-ema-close-20
Hello Sir,
I request a screener for the following conditions .
# price closed above 10 EMA in weekly time frame.
# 30 EMA crossed above 40 EMA in weekly time frame in the same scan.
Below is your scan:
https://chartink.com/screener/scan-for-siva-price-closed-above-10-ema-in-weekly-time-frame
Hi,
I want to create a ichimoku scanner.
buy scanner
which shows me a green 5 minute candle above below condition
1) conversion line crosses above base line
2) 1 st condition should meet above any cloud.
vice versa for selling.
Thanks in advance.
Below is your scan:
https://chartink.com/screener/scan-for-shivkumarsingh
Currently it checks if base line and conversation line is above cloud top
We are not able to use volume information in scans as you appears to be picking up the data from BSE.
BSE does not have much volume nowadays. NSE has good volume. So volume based queries fail to generate alerts.
Is it possible to use the data from NSE please?
Hello,
Currently we support only NSE cash stocks and indices in our scans.
hi, I have code of Historical Volatility of 100 days of any stock/ index. and it is more than 30.
Std(Log(c/Ref(c,-1)),100)*Sqrt(365)*100
guide me how to build screener in chartink.
Thanks.
Tapankumaar Dave
any one can make this scanner or indicator,Thanks
Currently such a scan is not possible as we do not support “log” function yet.
ok
thanks
Sir/Mam
Please help to make a scanner in chartink
my formula:
EPS LATEST QUARTER >1.2*EPS preceding year quarter AND
EPS latest quarter >0 AND
YOY Quarterly sales growth >20 AND
EPS last year >EPS preceding year AND
EPS > EPS last year AND
Profit growth 3Years >20 AND
Hi Chartink team,
Can you please help me how to create a Stochastic Cross Over Scan.?
I want my filter to Indicate when the signal line % D crosses the %K slow line, as in trading view (4,3,2)
Below is your scan (daily candle):
https://chartink.com/screener/slow-stockhastic-d-crosses-above-k-14-3-2
How to use % this function in scanning . Kindly provided some example of scanning .
Sure, below is an example scan for the same:
https://chartink.com/screener/stocks-gaining-more-than-2-10
Is this scanner for Awesome Oscillator correct? for period of 13 and 34?
( Latest Sma ( ( ( Latest High + Latest Low ) / 2 ) , 13 ) – Latest Sma ( ( ( Latest High + Latest Low ) / 2 ) , 34 ) )
Below is an example scan for the same:
https://chartink.com/screener/close-crossed-above-awesome-osscilator
Please help to make a scanner in chartink
formula:
gross block latest quarter > 1.2*Gross Block last quarter
Thank you
Currently we do have it in our scans for yearly time frame. Shall get with the team on quarterly time frame request.
Hi Chartink team,
Would you please add ATR TRAILING STOPS indicator ?
Thank You!!
It is possible using the formula. Below are a couple of example scans for the same:
https://chartink.com/screener/close-crosses-above-atr-trailing-stoploss-21-period-1-5-multiplier-daily-candle
https://chartink.com/screener/2-above-atr-trailing-stop-and-super-trend-sell-mode
Kindly provide intraday, swing and positional strategies for the premium subscribers. It will help us the beginners a lot in actual trading with learning and at the same time.
You can start by reviewing out top scans here: https://chartink.com/screeners/top-loved-screeners
They contain the top 10 scans used for Intraday/Swing & short term trading. These are sorted by most loved by members.
Dear sir, Good day to u.
Please help I want to create scan :::
1. GCO and VWAP BUY STRATEGY :::
= 5 MINUTE EMA ( CLOSE 13 ) CROSSED ABOVE 5 MINUTE EMA ( CLOSE 206 ) ,
= LATEST VWAP CROSSED ABOVE LATEST EMA (CLOSE,13)
2. GCO and VWAP SELL STRATEGY :::
= 5 MINUTE EMA ( CLOSE 13 ) CROSSED BELOW 5 MINUTE EMA ( CLOSE 206 ) ,
= LATST VWAP CROSSED BELOW LATEST EMA ( CLOSE, 13 )
THANKS. SIR
Sure, below are your scans:
https://chartink.com/screener/gco-and-vwap-buy-strategy-1
https://chartink.com/screener/gco-and-vwap-sell-strategy
Hit chartink Team
How to use % this function in scanner . Kindly provided some example of scanning .
Below is an example scan for the same:
https://chartink.com/screener/stocks-gaining-more-than-2-10
Hi Team,
I am looking for following scanner.
Hourly RSI near 30 and Price near hourly 50 SMA OR
2 Hourly RSI near 30 and Price near 2 hourly 50 SMA OR
Daily RSI near 30 and Price near daily 50 SMA.
Is it possible?
Hello,
By nearly you mean within 0.20 or 0.50%?
Dear Team,
Can you please let me know how to filter with Market cap like >= 1000 Crore or >=500 Crore etc. I could not find the same in the examples.
Sure, below is an example scan for the same:
https://chartink.com/screener/marketcap-5000cr
How to compare index with stocks or Index with Index? Suppose I want to compare Nifty 50 making Higher Highs and Banknifty lower Highs for the same period, how this can be a coded?
Currently we do not have this feature. We do plan on adding it in the near term.
I want to screen stocks having max volume in last 15 mins compared to today’s other 15 mins candle volumes can anyone help me to set up the scanner
We can check if current 15 min volume is greater than previous 20-30 or more candles. Will this help?
How to use Watch list Custom Columns ?
Plz Give me Scanner to Compare Index with Stock and Index with Index?
is there any Scan for Relative Strength regarding stock vs index ?
want scan for previous 52 Week high made befor Six month or year .
Difference between Previous 52Week high and current 52week high.
want scan for latest 52 week high made which is whose previous 52 week high was made before 1 year from cuurent date .
We did reply to your email received.
What is the difference between “Latest” and “1 day ago” Offset ?
Latest is the Last day candle and 1 day ago means previous day candle.
For example if you run on 28th Dec after market close — 28th Dec candle is latest and 24th Dec Candle is 1 day ago (note: 25, 26 & 27th are holidays)
Latest is current days candle (current price). 1 day ago would be for the previous day
Good PM sir, Please help me , i am lookimg for a scanner Condition 1:- [0] 1 hour price close above TC {CP narrow[within .1% of TC and BC] }, EMA 50 and Condition 2 :- [0] 1 hour price close below BC { CP narrow [ within .1% of TC and BC] }, EMA 50. Thank you.
Good morning. Below is your first scan. Let me know if this is okay and I shall create the second one.
https://chartink.com/screener/0-1-hour-price-close-above-tc-cp-narrow-within-1-of-tc-and-bc-ema-50
Good morning and Happy new year sir, I tried your 1st scan , it is well working sir, if it is possible please send the 2nd scan also. Thank you .
Happy new year! Below is your scan:
https://chartink.com/screener/0-1-hour-price-close-below-bc-cp-narrow-within-1-of-tc-and-bc-ema-50
I am unable to create the new scan with — Latest SMA(close,20) now the chartink only allows
Latest SMA(Latest close,20) – Which doesn’t give proper result.
I am able to copy from previous scans and edit the condition Latest SMA(close,20)
Please clarify
Yes, this is due to the recent upgrade: Latest SMA(Latest close,20) is also correct and results would be same
Hi,
I would like to have heading (Text box) for each subsection of scan wherein multiple conditions are in each subsection.
Hello,
Currently we do not have this feature. We may plan on adding it in the near term. Shall keep you posted.
Is it possible to scan option derivatives, ie nifty, bank nifty and stock options.
if not, is there a plan to include them in the near future.
Currently we support only NSE cash stocks and indices. We do plan on adding others in the future. Shall keep you posted.
Dear Sir,
I want to search stock in 1hr time frame.
condition in one hr time frame any candle EMA(1hr C,60) cross EMA(1hr C,240)
Please guide me how I can make scanner
Sure, below is your scan:
https://chartink.com/screener/ema-60-crosses-above-ema-240
Hi
can You get me a syntax to identify stocks that crosses the 1st 15m high in the next coming candles
Gap up and s the days 1st m candle high preferably
Sure, below is your scan:
https://chartink.com/screener/current-1-min-high-greater-than-days-first-15-min-high-2
Where i can obtain scan equations how to insert inputs please share if there is any videos
You may view tutorials on scans and alerts here:
https://chartink.com/articles/scanner/scanner-user-guide/
To set alerts for a scan, you need to click on “create alert” after opening the scan page and set your alert preferences accordingly.
https://chartink.com/articles/alerts/alerts-guide/
https://chartink.com/articles/alerts/desktop-mobile-a-k-a-web-notifications/
https://chartink.com/articles/alerts/webhook-support-for-alerts/
You can also start by reviewing out top scans here: https://chartink.com/screeners/top-loved-screeners
They contain the top 10 scans used for Intraday/Swing & short term trading
If you need help in creating a scan, please share your requirements, we shall create the same for you.
What a wonderful platform. Congratulations.
I hope I’ll be a long term customer of this platform.
Thanks
Nice to hear that 🙂
Awesome platform hope you can come with an APP as well. One query can we apply the filters to particular list of scripts?
Currently we do not have an app. We do plan on having one in the future.
You may create a watchlist here (https://chartink.com/watchlist/create) and run the scan against the watchlist. Currently running scans on a watchlist is a premium membership feature.
Thanks I have the premium membership .Please guide how to run the scan on watch list.
You may create a watchlist here (https://chartink.com/watchlist/create) and run the scan against the watchlist.
sir maine pay kar diya hai lekin paing softwear kaise use karna hai pata nani chal pa raha hai
You may view tutorials on scans and alerts here:
https://chartink.com/articles/scanner/scanner-user-guide/
To set alerts for a scan, you need to click on “create alert” after opening the scan page and set your alert preferences accordingly.
https://chartink.com/articles/alerts/alerts-guide/
https://chartink.com/articles/alerts/desktop-mobile-a-k-a-web-notifications/
https://chartink.com/articles/alerts/webhook-support-for-alerts/
You can also start by reviewing out top scans here: https://chartink.com/screeners/top-loved-screeners
They contain the top 10 scans used for Intraday/Swing & short term trading
If you need help in creating a scan, please share your requirements, we shall create the same for you.
मैं आपकी चार्ट इंक डाटा प्रोवाइडर कंपनी से लगभग 4 साल से जुड़ा हुआ हूं और बहुत ही शानदार काम आपकी कंपनी कर रही है मेरा आपसे निवेदन है हमें टेक्निकल इंडिकेटर बनाने के लिए कौन-कौन सी किताबें है मार्केट में जिनसे हमें इंडिकेटर बनाने में सहायता मिल सकती है कृपया उन किताबों के नाम बताने का कष्ट करें जिससे हम लोग और ज्यादा फायदा उठा सकें
9414450889
सुनील पंवार
There are quite a few for the same. You may try searching for them on google.
is it possible to scan stock week basis crossover 50 sma close cross above 200 sma but scan result both moving average when cross on latest weekly basis EOD – NOT cross result scan PREVIOUS CANDLE WEEK
Sure, below s your scan:
https://chartink.com/screener/sma-50-crosses-above-sma-200-weekly-candle
Is there any rule we can use to short the color of the candle like green and red
Sure, if current candles close is greater than open – its a green candle. If close is less than open, its a red candle.
please tell me how to use group function in atlas dashboard
Hope the below dashboard helps. You may click on “view query” on bar charts to review the same:
Does the paid version of Chartink provide datasets for US, currencies and cryptos as well?
If I subscribe, what do I get that is not available on the free version? Is there a trial subscription available?
Currently we support only NSE cash stocks and indices. We do plan on adding others in the future. Shall keep you posted.
We don’t provide trials as exchange charges high fees for realtime data, also we are dependent on third party services for SMS & Email used in our Alerts. Considering this, we allow full access to our charts & scans for free with delayed data.
As a premium member you would be able to:
Access realtime data for Charts & Scans every minute
Create Alerts and receive updates of stock breakouts over sms/email/mobile/desktop/webhooks
View charts in 1/2/3 minute timeframes with auto-refresh
Run screeners in 1/2/3 minute timeframes with auto-refresh
Scan any watchlist via the segment dropdown of a scan
Set scans to private
Customized Atlas dashboards for market overview
Get Dedicated support for your scanner requirements
You can get details/signup our premium service here: https://chartink.com/subscription
Hi Sir,
I tried to create a scanner using camarilla formula(H3 and L3) on monthly basis. However,did not get appropriate result. Is there any way to relate monthly H3 to one months ago H3 and monthly L3 to one month ago L3 ?
H3= Close+(High-Low)*1.1/4
L3= Close -(High-Low)*1.1/4
It should be,
1 month ago H3 > Monthly H3
AND
1 month ago L3 < Monthly L3
I strongly believe it will leads us to a breakout or breakdown.
Please help !
Sure, below is your scan:
https://chartink.com/screener/1-month-ago-h3-monthly-h3-and-1-month-ago-l3-monthly-l3
Awesome Sir !!! Thank you very much..
Hi, I would like to see the list of stocks FIRST 15 Minutes candle is Green for DAY BEFORE YESTERDAY (Not for Today). I am able to get it for current day, but not able to get for Day before Yesterday. How can I scan it?
Sure, below is your scan:
https://chartink.com/screener/days-first-15-min-candle-green-day-before-yesterday-2-days-ago
i have created this scanner
https://chartink.com/screener/ltp-cross-below-200-ema-on-5-min-timeframe
though mindtree stock is below 200 ema on 5 min timeframe it is not
shown in results
i have ran this scanner on future segment
why so?
it works fine, result in which stock was not shown was run on watchlist that didnt contain mindtree stock.
Okay Great!
It would show the same in results. For which date and time was this? Also, please verify results on cash segment charts as currently we support only NSE cash stocks. We have only created a segment group called ‘futures’ to scan stocks that are traded in the F&O group. If you select futures, scanning will be done on basis of cash stock prices/ values.
Wonderful tool. Just loved it. I am still practising trading on paper and will join the premium version once confident.
I was trying to create a scan to get two latest consecutive candles cutting upper bollinger band and also the latest candle opening above the previous candle. Both candle must be 1 hour candle.
I tried creating scan but results are wrong.
Hello,
By cutting upper bb, you man crossing above it or candles high greater than upper bb?
Sorry i forgot to paste the link of scan:
https://chartink.com/screener/copy-upper-bollinger-band-crossover-daily-4241
Below is the modified scan. Please check now:
https://chartink.com/screener/copy-upper-bollinger-band-crossover-daily-4241
is there any way I can get numberical values of indicators such as vwap, 200 ema ?
*numerical
Sure, you can plot the same on Atlas dashboards. Below is an example dashboard for the same:
https://chartink.com/dashboard/40748
is it possible to import this info in excel realtime
without manually copying and pasting.
There is a download option for the same. You may click on it and it will download all data in an excel file.
What is the definition of Current Candle? Is it the latest completed candle or the in-progress Candle?
For example, if I use “[0] 5 minute” in the scan condition, at 9:32 AM, will it refer to the candle from 9:25-9:30 or the in-progress candle from 9:30-9:32?
Hope the question is clear.
It is the in-progress candle. if you run it at 9.32 am, it will check for stocks on the incomplete candle (9.30-9.35am. )
good PM sir, please help me to create a HEIKIN ASHI candle sticks pattern :-1st candle = Indefinite Green candle and 2nd candle= Full body Green candle [ should open=low] for Daily candle chart. thank you
Below is your scan:
https://chartink.com/screener/scan-for-b-n-r-reddy
Sir, above i mentioned Heikin Ashi candle pattern for bullish reversal , which i forgot to mentioned.
https://chartink.com/screener/scan-for-b-n-r-reddy
Sir,my request is a bullish candle[2nd candle] followed by an indefinite candle=1st candle [ that is :- close greater than open and high greater than close, low lower than open] , please help me.
Can you please share an example chart image for the same on [email protected]
sir just now i sent an example chart image of Heiken ashi bullish reversal pattern for your reference to your email. my email is [email protected] . please help me, thank you
Sir ,( i am confused with the mix and max) With folded hands i request you to help me create a scanner with the following condition.
1. i need previous swing high in 5 min time frame
2. i need previous swing low in 5 mins.
3. latest swing high is higher than the previous swing high
4. currenent price is less than the latest swing high and is greater than 1 % of previous swing low
Hello,
Currently detecting previous swing high is not possible. We can check if current candle is above previous 25-30 candles high or more. Will this help?
I want to create a scanner where current close is within range of 95% to 100% of past 120 days high.
How to create the same as crossed above gives results for stocks that have crossed 95% of previous 120 days high on specific day it does not consider if the same was crossed 2 days ago or 3 days ago and greater than gives results of current close which are above previous 120 days high and if then another less than i.e range between current close and 120 days high is added in filters than also it gives results of current close which are above 120 days high but however this is to be excluded as only when a stock comes between range of 95% to 100% of previous 120 days high it should be catched.
i am fed up please help me as a filter of
Latest close greater than equal to latest max(120,latest high*0.95)
Latest close less than equal to latest max(120,latest high)
my query is though i have added less function
Latest close less than equal to latest max(120,latest high)
but it shows in screener those stocks also which are trading above high of past 120 days and thus i am not able to screen those stocks which are only in range of 95% to 100% of previous 120 days high
Below is your scan:
https://chartink.com/screener/stocks-within-5-of-120-day-high
hi
how to access
the group high
the group low
etc
it is not showing in the create scanner
These functions can be used on Atlas dashboards only.
Hi,
Where can i find ROE % filter?
waiting for a reply…
please answer….
Sorry for the delay, you can use this formula for the same “Yearly Net profit/reported profit after tax / ( Quarterly Total number * Quarterly Close / 10000000 ) as ‘ROE ‘”.
I created th dashboard for the same: https://chartink.com/dashboard/43897
Kindly provide a dedicated filter option for ROE .
Below is an example scan for the same:
https://chartink.com/screener/roe-greater-than-15-and-qnq-sales-up-by-20
What is the difference between these queries?
6 days ago MAX (252, Latest HIGH) & 6 days ago MAX (252, 6 days ago HIGH).
I need to scan for stocks which might have crossed their 52 Week High in the last 5 days.
Which of these below is correct?
Latest High ‘Greater than equal to’ 6 days ago MAX (252, Latest HIGH)
Latest High ‘Greater than equal to’ 6 days ago MAX (252, 6 days ago HIGH)
Since both are giving different results, I need to understand the logic of both.
Hello,
Taking 6 days ago outside as well as inside the bracket will add the same and calcuate it as 12 days ago. The below would be correct for 6 days ago:
6 days ago MAX (252, Latest HIGH)
Hi
I am looking for a scanner where i want the close price of all the candles (may be last 20 candles or 50 candles)remains above supertrend with out closing below supertrend and also want to scan the close price crossed above the supertrend first candle which has turned supertrend positive
Also how to check last 50 candles(or any number) stays above 40 rsi only where not even single candle went below 40 rsi
Below is your scan:
https://chartink.com/screener/close-below-supertrend-since-last-20-candles-5-min
Thanks for the info but here i dont know whether the first candle or 2nd candle or 5th candle or 10th candle close was greater than super trend i want scanner where let say any candle close has crossed above supertrend and from that candle all the candles close remain above supertrend and also any candle close above the candle which has crossed above the supertrend candle which changed supertrend to positive………
example—– let say today 5th candle close has crossed above supertrend which made it positive now next all the candles close should remain above supertrend and also let say 10th candle close crosssed above 5th candle which made supertrend positive
note — number i have mentioned are reference only those number can be any number
Currently this would not be possible. We need to enter the previous “n” number of candles for the scan to go back and check for. We can check if days first candle crosses above supertrend and any of the next five candles close above the high of the 5th candle. Will this work?
Dear Team,
I have premium subscription but the alerts for below screener is different from what is showing in the back results today
https://chartink.com/screener/volume-shockers-on-3-min-frame
There are chances that the backtest results may not match with the alerts history if multiple timeframes are used in the scan, please read our for more details: https://chartink.com/articles/backtest/bactesting-faq/
How to use OR condition in scan.
It by default takes AND.
Hello,
You may use sub-filters for the same. Below is an example scan:
https://chartink.com/screener/scan-using-sub-filters-or-function
what is use of min duration and max duration plz give example
Hello,
Below are a couple of example scans for the same:
https://chartink.com/screener/stocks-near-52wk-high-2
https://chartink.com/screener/stocks-near-52wk-high-2
Hope this helps: https://chartink.com/articles/scanner/scanner-user-guide/
Is there any command to get the median of last n values?
You may directly use the offset for the same. For 3 days, it would be one day ago close and so on.
Hello sir I just let u know that if the nifty and bank nifty crosses the 5th candle in 5mins time frame
If crosses below 5th candle -sell
If crosses above 5th candle -buy
Plz write this in condition and want to to back test for that. Thanks
Below are your scans:
https://chartink.com/screener/current-1-min-high-greater-than-days-5th-5-min-candle-high
https://chartink.com/screener/current-1-min-low-less-than-days-5th-5min-candle-low
hi
CAN I BE ABLE TO GET PVT AND SMA 20 CROSS OVER SCRIPT ?
Below is your scan:
https://chartink.com/screener/price-volume-trend-pvt-crossover-pvt-sma-20
Hello,
I need to scan the stocks which are matching the following criteria,
today’s (trading day) 1st 5-minute candle’s volume greater than the highest volume of past 75 5-minute candle’s volume
Below is your scan:
https://chartink.com/screener/1st-5-minute-candle-s-volume-greater-than-the-highest-volume-of-past-75-5-minute
Nifty 200 list of companies is of last month. Kindly update the same.
Thanks for notifying the same. Shall have it updated shortly.
Thanks for the response.
However, Dixon technologies RSI is showing wrong value. Whenever I am running scan as RSI (14) crosses below 35 or RSI(14) less than 35, it is showing Dixon for the last 2-3 days. Kindly check the same.
Yes, we are working on getting it corrected. Its due to recent stock split.
is there any solution of wrong value shown for stocks which is recentry split
Hello,
We update the corporate actions on stocks over the weekend. Can you please share the name of the stock, so we can cross-check and update the same?
still its not corrected
Hello Dilipsinh,
Can you please elaborate more on this? Are you referring to your previous comment about the stock split? If yes, can you please let us know the name of the stock so we can cross-verify and rectify the incorrect data?
Hello sir,
Can you please help in making a scanner?
Conditions:-
-On 5 mins time frame chart
-After 1:00pm mark the next candles high and low (i.e of 1:05pm high/low) and then the next 3 candles (i.e 1:10pm,1:15pm,1:20pm body)-body(open/close) should be within the 1:05pm candles high/low.
i should get the stock on 1:20 pm candle close.
Below is your scan:
https://chartink.com/screener/3-candles-close-open-in-a-range-of-first-candles-high-low-1
I want to apply a scanner which has the following arrangements :-
first condition is:- if any candle closed above a particular price….
then filter the stocks for which latest candle closes above the candle that met the first condition.
However, these two candles can be in continuation or the second candle might come after 3rd or 4th or so on position after the firs candle
Currently this is not possible. We can check if current candles close is greater than previous “n” number of candles (say 20-25 candles). Will this help?
HELLO SIR, I MADE A SCANNER OF PREVIOUS LOW AND HIGH BOTH ARE BREAK IN 15 MIN TIMEFRAME.
FOR EG, XYZ SCRIPT, LOW=100 AND HIGH =103 THEN LOW IS BREAK FOR EG= 98 AND THEN HIGH IS BREAK FOR EG= 105. IN THIS TYPE OF SCANNER HOW TO MADE ?? PLEASE GUIDE US ..
Do you want current 15 min high and low breaking previous candles high and low?
THANK YOU CHARTINK ,YOU REPLY ME… NO SIR, ACTUALLY NOT CANDLE BUT PERVIOUS LOW AND HIGH PRICE ARE BREAKS . I HOPE , THIS STRUCTURE WILL HELP US TO UNDERSTAND
SECOND BREAK HIGH HH=105
PERVIOUS H=103 H =HIGH L =LOW
HH=HIGHER HIGH
PERVIOUS L=100 LL =LOWER LOW
FIRST BREAK LOW
LL= 98
ACTUALLY PRICE GO 100 ,103, 98 , 105 \ low ,high, lower low, higher high
1 step = price is 100= low
2 step = price got to 103= high
3 step = 103 to direct 98 break the low 100 price is = 98 =lower low
4 step = 98 to direct 105 break the high 103 price is= 105= higher high
Currently detecting previous hh and lower low is not possible as we need to enter previous “n” number of candles for the scan to go back and check for. We can currently check if current candles high is greater than previous 10-15 candles high and so on
How can I create a scanner for a condition of current price is crossing days high and is above yesterdays high also. (for intraday scripts)
Below is your scan:
https://chartink.com/screener/price-is-crossing-days-high-and-is-above-yesterdays-high-also
Hello sir
Can u guide me in 5 minute time frame if candle bullish or bearish crosses d 50 moving average and that stock have high volume…
Below is your scan:
https://chartink.com/screener/5-min-close-crosses-above-sma-50-and-volume-greater-than-previous-5-candles
I have one query that can we change colors of candlestick from white /Red to Green /Red?
If yes then pl. let to know how?
Currently we do not have this feature. We do plan on adding it in the near term. Shall keep you posted.
Hi , wanted to know n day ago e.g 21 days ago means 21 trading day or 21 calendar day
It is 21 trading days.
Hi Team,
I want all the stocks whose monthly average volume is greater than 5lakh.
Your help will really be appreciated.
Below is your scan:
https://chartink.com/screener/22-days-1-month-avg-volume-greater-than-500000
How can i create a scan i.e, current volume of 5 min candle(single latest candle) must be 5 times greater than average volume of previous 50 candles.
Below is your scan:
https://chartink.com/screener/5-min-candle-single-latest-candle-must-be-5-times-greater-than-avgvolume-of-previous-50-candles
Thank you so much!
Sir,
Need a query for 1 day ago’s 1st 15 minutes range should not be broken whole day & current day High & low should be equal to or within the previous day 15 minutes High low range.
This scan and many others are possible. We provide dedicated scanner support only to our premium members which allows you send your scan requirements and we create and share the scan with you. You review examples scans or create your own scan by following our scanner guide here.
How to create scanner which will give signals only after first 2 candles and will not give any signals after 3PM in different timeframes like 3min, 5min, 10min, etc. Also, what do you suggest on keeping the checking interval while creating alert for the same scanner?
Thanks a lot in advance for help.
If you need a scan which starts after 10am, please use code: [=4] 15 min close greater than 0. To stop alerts after 3pm, you may use a sub-filter and say “stock fails all” [24] 15 min close less than 0.
what if i dont want any stock in scanner after 9.30 in 5 min time frame ?
you may use the below condition:
Stock “fails all”
[=4] 5 min close greater than 0
Hi there, can you please tell me how to scan the 5 min candle which has the high greater than the high of prev 15 days.
Below is your scan:
https://chartink.com/screener/current-5-min-high-greater-than-previous-previous-5-days-high
Hi, need one help, how do I filter out stocks which appear in the same scane for x number of days? For eg. I created a daily scan where it filters stocks which have moved by more than 5%. How do I filter our stocks that have been featuring in the daily scans on all days for lets say 5 days or 7 days?
Below is an example scan for the same:
https://chartink.com/screener/stocks-gaining-more-than-5-since-5-days
hi, i want to scan stocks that break out Dynamic zone-(Daily) time frame.
plz help
Can you please share an example please?
how to put latest stock scan on top and any way we can add time to it also
Currently no. We do plan on adding this feature in the near term.
Hi,
I want to create stock specific scan. For examples reliance price is less than or equal to 1920 and greater than 1910 .This kind of band scanning i needed for my chosen stock. Can you please help me out.
Regards,
Sathish.S
Currently only way to do this is to run the scan against the watchlist with the stock in it. You can create a watchlist here: https://chartink.com/watchlist/create). Below is an example scan for a stock crossing above 1500.
https://chartink.com/screener/close-crossing-above-1500
I just joined chartink.com. Seems like a great platform till now.
I was trying to code for my own scanner but I’m facing an issue and I am not sure how to resolve it. Please help me with that.
What I was trying to do is:
On a 15-min time frame, I’m trying to see the “ema crossover”
like lets say if the price is above 50 ema
and I want to see if in that case ema(10) crossovers ema(20)
Sure, below is your scan:
https://chartink.com/screener/price-is-above-50-ema-and-ema-10-crossovers-ema-20
Wouldn’t this add up, the 15 minute outside and inside the bracket, and make it 30 minutes? You mentioned something similar in another comment here.
Hello,
Thanks you so much for the scanner.
I couldn’t find it anywhere but I thought I will ask, that can we apply alerts on trend line also like in trading view, in premium chartink?
We can try creating such a scan and set alerts to the same. Below are a few scans created by members on the same:
https://chartink.com/screeners/search?search_term=trendline
Can we check any 2 conditions in sub filter instead of just any and all??
You may add another sub-filter within a sub-filter for the same.
Hi, how much time does it take to activate the premium account after payment?
Its an automated process and is activated immediately.
even using custom dasboard we could not connect chartlink message alert to the Telegramme please help us to solve the problem .mobile no. 9823122255
Please email us at [email protected]
Hey thanks for the great work chartink is doing!
I’m creating a screen where along with other criterion I want stocks whose free float market cap is below 6000 crores and the 3 month’s average volume is above 10000 shares.
Despite various iterations I’m yet to find the right conditions for them. In the screen many stocks whose ff mcap is below 6000 crores as mentioned on nse website get missed by the screener.
I’m not sure whether 3m average volume criteria I’ve devised as 13 weeks average volume is correctly being put or not. Can you please confirm that as well? Thanks once again!
https://chartink.com/screener/copy-manas-arora-by-owais-3
Sure, below is a scan for the same:
https://chartink.com/screener/free-float-market-capitalization-less-than-6000cr
hi,
I need scan for if
1. Today’s high 3 percentage higher than open price and close 0.25 percentage above open price.
2. Today’s low 3 percentage lower than open price and close 0.25 percentage below open price.
Can Any one please help me out.
Thanks
Omprakash.
Awaiting for any one reply please…….
Kindly please response any one from Admin…
Below is an example scan for the same:
https://chartink.com/screener/today-s-high-3-percentage-higher-than-open-price-and-close-0-25-percentage-above-open-price
Tried multiple times , but did not set the proper filter. Can you please help.
Requirement is —
1. 5 EMA cut from below to 13 EMA within last 3 day.
2.5 EMA cut from below to 26 EMA within last 2 day.
3. MACD line (Blue line) cut from below the MACD signal line(Orange line) within last 2 days
4. RSI is greater than 60 and less than 70
Can you please help to set the filter like this?
I tried using “JoRRMethod” but not succeeded.
I am wondering how to set “within last 3 days” part.
Thanks in advance.
Sure, below is your scan:
https://chartink.com/screener/scan-for-sarita-1
Good Morning Sir,
I have just took premium membership and i just loved the Chartink.
Sir, i am stuck in creating a scan that, “the lengths of two candlesticks of similar lengths and one of candlesticks must be bullish and the other one is bearish .” Sir can you help me creating this scan. (candlestick timeframe 10 minutes)
Hello,
We can check if 2 candles size (high-low) or body (open-close) is within 1-1.20% and one is green and another red. Will this help?
Yes Sir, Please create this scanner. Thank You Sir.
Below is your scan:
https://chartink.com/screener/high-low-is-within-1-20-and-one-is-green-and-another-red
Hi Team, If i want t add a condition like NIFTY 50 Close is above EMA 200, how can I do it.
ONe way is to keep the NIFTY 50 in a watchlist and run the scanner on watchlist. I want to add this condition to other conditions as a “AND” condition. Can you please help.
There are some “Symbol” option, but I am not sure how to make use of it.
Regards,
Manikanth
Currently we do not have this feature. We do plan on adding it in the near term. Shall keep you posted.
HI,
need one help
In backtest history section, we have daily bars and the time shown when we hover over a bar is “12:00:00 AM” . can you pls let us know if these scanners gets run automatically at midnight .like for 28th May scanner, it will be running at midnight 12:00:00 AM . i don’t see this is the case as i dont see any scanner results appear in backtest results for that day till market opens. can you pls confirm how these bars in backtest history get created and at what time.
thanks.
Rahul
Since the scan is based on daily candle, it will only display the date when these stocks matched the scan criteria. On smaller time frames, it will display the starting time of the candle.
Does this mean, Morning 9:15 AM it will be ready ???
Yes, first results will come in from 9.16am
How can filter/scan IPO listed in last one years ?
Currently, this would not be possible.
Hello !!! Team,
I need a list of 20 days high and 20 days low stocks. Please share the link.
Thank you
Below are your scans:
https://chartink.com/screener/current-close-at-20-day-low-1
https://chartink.com/screener/current-close-at-20-day-high-1
Latest Close = Latest Max ( 200 , Latest High )
I have give this filter, but the screener show the wrong result. can you explain ?
You may use “latest close” greater than equal to 1 day ago max 200 high
how to find stocks crossing above 44 SMA in 15 min. time frame in post market hours.
Below is your scan:
https://chartink.com/screener/15-min-close-crosses-above-sma-44
Sir , pls help by creating a scan which can give a list of cash stocks which are flat in narrowest range for minimum 35 days in mid bollinger band & also gives a result went break out happens in 5 mins chart , I am a premium member but unable create it or find help
Hope the below scan helps:
https://chartink.com/screener/bollinger-band-squeeze-within-10-35-days-and-now-a-breakout
Please add Delivery % in your scan.
e.g. counters with more than 50% Delivery Volume.
Currently we do not have delivery % in scans. We may plan on adding it in the future.
Hello, have you added delivery feature in scan? thanks.
Hello,
We do not have the delivery feature in our scans yet. We will surely keep you posted as and when there is any development on this.
Hello Team,
Have you added delivery % in scans yet ?
Hello,
Please note that, as of now, we are working on improving our UI. We don’t want to rush with the feature and give you results based on incorrect data. That is the reason this might take some time. We hope you understand.
How to create scan for Positive-negative crossover for super-trend(14,4) in 15 min. candles
Here are your scans:
https://chartink.com/screener/close-crossed-above-suertrend-14-4-15min
https://chartink.com/screener/close-crossed-below-supertrend-14-4-15min
I want to Calculate the Relative Strength of a stock with Respect to NIFTY (index) of say last “x” days. How do we do that?
Hello,
Currently, we do not have a Relative Strength. We may plan on adding it in the near term. Shall keep you posted.
Hi there, could you please tell me how can I create a scan with the below condition:
Stocks having the 15 minute high volume than previous day . But here the 15 minute candle is not latest and it may be 4th, 5th and any number of candle throughout the day. If I run this scan at 3 P.M then the scan must be able to show the stocks which have had 15 min candle having high volume than previous day in the morning too.
Currently, this would not be possible as we need to enter the previous “n” number of days for the scan to go back and check for. We can check if current 15 min volume is greater than previous 50-60 or more candles.
Ok, Thank you!
I need to create %PPO scanner using the following logic:
Percentage Price Oscillator (PPO): {(12-day EMA – 26-day EMA)/26-day EMA} x 100
Signal Line: 9-day EMA of PPO
I can create my own indicator for PPO (as it is not available) but I am not able to use the created indicator PPO for the Signal Line.
Can you help me create the scan?
Thanks
Hello,
Here is your scan:
https://chartink.com/screener/close-crossed-above-9-day-ema-of-ppo
how to add that candle test like “[-1] 5 minute” in a scan? please tell step by step
Hello,
After selecting the timeframe you can click on [0] , and you will get the same[-1] from the dropdown list
can we copy a whole scanner into a dashboard? if yes then how?
Hello,
You can click on the red symbol to copy the scan and past it by clicking on the symbol which is next to the “+” sign in the filter section of the dashboard.
Is it possible to scan stocks that has close price of xxx.90 ? Example 123.90, 786.90 etc.
Hello,
Here is your scan:
https://chartink.com/screener/stocks-that-has-close-price-of-xxx-90
Thank you so much team. Really appreciate your efforts !!
is there anyway to create a scanner with put/call ratio?
Hello,
Currently, we support only NSE cash stocks and indices. We do plan on adding others in the future. Shall keep you posted.
Can some please help me how to give 2 logic in one strategy. eg. Below query 1 and 2 should satisfy OR 3 and 4 should satisfy. How to give this in one strategy please advise.
1– 0[15] volume > sma(volume,3)
2– 0[15] open > 0[15] min close
OR
3 — 0[15] OPEN > -1[15] close
4 –0[15] open > -2 [15] close
Hello,
Here is yourscan:
https://chartink.com/screener/open-greater-than-close-or-open-greater-than-previous-2-closes-15min
Hi,
Thanks for great service.
I want to make a simple screener that will tell me all stocks with 5% increase in volume since yesterday. And I only want today’s volume compared to yesterday’s volume only. Not 10 days average volume.
How can I write it? Please help me.
Hello,
Here is your scan:
https://chartink.com/screener/todays-volume-is-greater-than-yesterdays-volume-by-5
Hello.
Want to spot bullish move in Nifty Index Option Strikes right after market open (9:15 AM to 10:00 AM) in Intraday. Because this is the time when the big/ explosive moves happen most of the time. Want to catch an average move of minimum 30 points daily within this time. Can we make such a scanner with real-time update/ refresh on 1 minute TF?
Also need suggestion on scanner settings required to catch such explosive moves just before they happen.
Is it about a combination of Volume Burst + OI Change from Open? or something else.
If my purpose is going to be solved, I am ready to join your paid subscription for sure.
Please contact on 7387064634
Hello,
Currently, we support only NSE cash stocks and indices. We do plan on adding others in the future. Shall keep you posted.
THANK YOU FOR GREAT CERVICE.I WANT TO KNOW ABOUT YOU.
any way to find the most fluctuating stocks for intraday?
We can check for stocks gaining or losing more than 5%. Will this help?
that i know but fluctuation is different, like oscillating between a fixed price or %
I DONT UNDERSTAND HOW TO USE THIS ‘CHANGE’.
CAN YOU SHARE SOME EXAMPLES
Below is an example scan for stocks gaining with 1-2%
https://chartink.com/screener/stocks-gaining-within-1-2
this i know, i asked about the ‘%change’ attribute in your scanner
any example for heiken-ashi green candle check?
Hello,
Here is your scan;
https://chartink.com/screener/heiken-ashi-green-candle-for-daily
dear AKHILESH
greetings !
do u know how to contact B.NETWORKS customer service ?
Do u have any tel no or address for B. NETWORKS?
My chart screen is blank despite updated for 1 year as premium membership
Thank you in advance
regs
anand srivastava
do you have any directory for all of your filters and their definition or use or derived formula or dependent variables or purpose?
Currently we do not have these. Shall get with the team on your suggestion.
Hello Team,
How to add offset parameter to SMA.
EX : SMA(2,H,1)
Where 2 is SMA OF 2 PEROID , PLOT SMA ON HIGH OF CANDLE AND 1 IS OFFSET.
Hello,
Below are some examples:
1 day ago Sma ( Latest High , 2 )
[-1] 1 hour Sma ( [0] 1 hour High , 2 )
Thanks for reply.
I am using investing .Com for charting,
Consider 5min chart, when I add SMA on 5min chart it adds like below
MA(2,HIGH,1)
There are three parameters of MA
Length=2
Source=HIGH
Offest=1
I am talking about third parameter Offset=1..
How to add third parameter of SMA in Chartink scanner?
It would be great if you guide me.
Hello,
Here is an example: [-1] 5 minute Sma ( [0] 5 minute High , 2 )
Thank you
What is the use of “Symbol” under Stock attributes?
It is usefull in the Atlas dashboard for arrange the ascending and descending orders
Hello Team,
Pls help me to code below given requirement.
Consider 5 min chart.
The difference between current candles CLOSE and 10 EMA should be 0.25% of Stock Price.
Hello,
Here is your scan:
https://chartink.com/screener/the-difference-between-current-candles-close-and-10-ema-should-be-0-25
Thanks alot…Great Team and Superb support…Kudos….
I am building a scanner for Stochastic RSI curves crossover. There are 4 Indicators available in Chartink Scanner:
1) Slow Stochastic %K
2) Slow Stochastic %D
3) Fast Stochastic %K
4) Fast Stochastic %D
Which two variables I need to use. I am totally confused. Please help
Hello,
Here are example scans:
https://chartink.com/screener/k-crossed-above-d-daily
https://chartink.com/screener/k-fast-crossed-above-d-fast-daily
how to add this condition in scanner:
volume of days first 5 min candle is higher than previous days all 5 min candle
Hello,
Here is your scan:
https://chartink.com/screener/volume-of-days-first-5-min-candle-is-higher-than-previous-days-all-5-min-candle
Friends, Any good Futures Shorting Screener/Scanner. appreciate your help
Hello,
Currently, we support only NSE cash stocks and indices. We do plan on adding others in the future. Shall keep you posted.
Dear Sir,
Please help me
buying range of shares formula for time frame 5 minutes
Stock percentage within 1 %
period of short time
Hello,
Here is your scan:
https://chartink.com/screener/5min-current-close-greater-than-prev-5min-close-within-1
Dear Sir
Kindly find my below requirement
5 min time frame( min candle 50 trading within 1% range) the last candle close should be grater then Bollinger band uper line.
I hope you understand my requirement
Thanks and regards
Krishna
Dear Sir
Kindly find my below requirement
5 min time frame( min candle 50 trading within 1% range) the latest candle close should be grater then Bollinger band uper line.
I hope you understand my requirement
Thanks and regards
Krishna
Hello,
Here is your scan:
https://chartink.com/screener/range-within-1-last-50-candles-of-5min-and-current-close-greater-than-upper-bb
Hello Team,
Pls help me sir to code below given requirement
SMA 50 and LOWER BOLLINGER BAND TOUCH TO THE CANDLE ON 15 MIN AND 5 MIN CHART
Hello,
Here are your scans:
https://chartink.com/screener/sma-50-and-lower-bollinger-band-touch-to-the-candle-on-15-min
https://chartink.com/screener/sma-50-and-lower-bollinger-band-touch-to-the-candle-on-5-min
is there any filter which tells history of market orders on 1 min candle?
Do you want the total number of shares exchanged?
the buy and sell quantity at that particular time
Dear Sir
Kindly find my below requirement
5 min time frame( min candle 50 trading within 1% range) the latest candle close should be grater then Bollinger band uper line.
I hope you understand my requirement
Thanks and regards
Krishna
filter suggestion, ‘halftrend’, can you include it asap?
Dear Sir
Kindly find my below requirement
monthly breakout
weekly breakout
daily breakout
15 min time frame( min candle 15 trading within 1% range)
I hope you understand my requirement
Thanks and regards
Krishna
Hello,
Here are your scans:
https://chartink.com/screener/15min-breakout-within-1-range
https://chartink.com/screener/daily-breakout-within-1-range
https://chartink.com/screener/weekly-breakout-within-1-range
https://chartink.com/screener/monthly-breakout-within-1-range
is there anyway to get order quantity, buy and sell both of a sock at a particular time, in backtest?
Currently, this would not be possible. You can create an Atlas dashboard to view the same for previous candles using -1, -2 and so on.
can we view previous order quantity in atlas? can u show how?
monthly time frame breakout
weekly time frame breakout
daily time frame breakout
monthly close should be grater then Bollinger band uper line.
weekly close should be grater then Bollinger band uper line.
daily close should be grater then Bollinger band uper line.
Hello,
Here are your scans:
https://chartink.com/screener/monthly-or-weekly-or-daily-breakout
https://chartink.com/screener/monthly-or-weekly-or-daily-close-greater-than-upper-bollinger-band
Hi Team,
Please help me on creating a scanner on below requirement.
1. I want to know the stock details which is breaking the volume, which is needed to compare to last five to 10 days volume.
2. I want to know the stock details which is breaking the volume when we compare to previous day.
Thanks,
Hello,
Here are your scans:
https://chartink.com/screener/volume-greater-than-last-10-days-maximum-volume
https://chartink.com/screener/volume-greater-than-previous-day-volume-5
Hello Team,
Pls help me sir to code below given requirement
SMA 50 FALLING and UPPER BOLLINGER BAND TOUCH TO THE CANDLE ON 15 MIN AND 5 MIN CHART
Hello,
Here are your scans:
https://chartink.com/screener/sma-50-falling-and-upper-bollinger-band-touch-to-the-candle-on-15-min
https://chartink.com/screener/sma-50-falling-and-upper-bollinger-band-touch-to-the-candle-on-5-min
sir my query has not been resolved
Can you please share the same again?
Hi
I wish to restrict scan results to a specific time period (Between 9:30am to 3:00pm)
How to get that done
Thanks
Hello,
You can use below conditions with the scan:
https://chartink.com/screener/scan-run-between-9-30am-to-3-00pm
Is it possible to get price column ( when conditions met, not LTP ) in back test results ?
Hello,
Currently, one can add/edit the column in the Atlas dashboard.
We are working on creating tutorials for the same. In the meantime, please try reviewing the following videos created by our users:
https://www.youtube.com/watch?v=CQxwElElgvA
https://www.youtube.com/watch?v=buC4UaDX18g
https://www.youtube.com/watch?v=CMwNTsGi0Yw
https://www.youtube.com/watch?v=XuHTvJoslm8&t=40s
KELTNER CHANNEL is long awaited
Hello,
It can be created by using the formula. Below is an example scan:
https://chartink.com/screener/close-less-than-keltner-lower-band-for-daily
can we put a filter in atlas dashboard for like to not show a stock if it has already popped up like more than 10 times in last 1 hour or whole day? or to show the unique stock at top?
Currently, no.
Hi am trying to create a scanner for the choppiness Index, Pls help to translate this formula
CI = ( 100 * LOG10( SUM(ATR(1), n) / ( MaxHi(n) – MinLo(n) ) ) / LOG10(n) ) LESS THAN 38.2
I tried in the below link, but i am making some mistake. So Please help me to correct it
https://chartink.com/screener/ci-test
Hello,
It can be created by using a formula. Here is your scan:
https://chartink.com/screener/choppiness-index-14-less-than-38-2
this choppiness scanner is still not visible in derived list from dropdown.
Hello,
This will not be visible in your dropdown as it is a custom indicator created at our end. To show this in your dropdown, you must create this custom indicator at your end (https://chartink.com/indicator). You can copy/view the formula used by clicking on the purple sign next to the indicator. I hope this helps.
What is the screener for checking that the first 15 minutes volume of a stock TODAY, is greater then, 30 times, the average stock volume for first 15 minutes on 10 previous trading days!
Hello,
Here is your scan:
https://chartink.com/screener/1st-15min-volume-is-greater-then-30-times-the-avg-volume-for-1st-15min-on-10-previous-days
Hey Chartink Support Team/ The Team Member who supported on this:
Greetings! and Many many thanks for you kind effort – it really touched my heart that you provided this help!
YOU GUYS ARE AMAZING!
Hello,
Thank you for your feedback and appreciation. We are happy to help you.
is there any way to calculate the slope of any indicator?
Do you mean SMA falling since previous 5-10 candles?
Could you help me find a scan with the below criteria please –
Weekly Close is greater than All Time High
Hello,
Currently, we do not have an all-time high feature. We need to enter the previous ‘n’ number of candles to check breakout or breakdown.
For example weekly close greater than its previous 52 weeks high:
https://chartink.com/screener/weekly-close-greater-than-its-previous-52-weeks-high
Please check and let us know will it work for you?
What is meaning of [=1]… and so on.
Hello,
For Example:
[=1] 5min means days 1st 5min candle
[=2] 5min means days 2nd 5min candle
and so on..
Alerts not coming for some reason on my scans. It was working fine till now. Since today morning even though backtest shows stocks in scan real time alerts are not coming. Not even in triggered list. My subscription is not expired or anything.
Hello,
Please share the link/ url for the scan along with an example so we can review and respond.
halo sir
awsome screener
is there any way to screen the stocks which are in resistance or support level using this .
if so pls inform
with regards
shameem
Hello,
Are you looking for some specific support or resistance levels like pivot, camarilla, or any other?
Hi,
I am not able to find the logout button on the page. I accidently logged in through my free account and now i want to login using my paid account. However, I am not able to find the logout button
Regards,
Rahul Barnes
9731931291
Hello,
Under the “Dashboard”(Top left corner), you will get the “Logout” option here: https://chartink.com/scan_dashboard
Sir,
I want to explore some possibilities before subscribing. please let me know that if a scan for a particular time period for the day, For example
1.) one candle (5 minute) back close is crossed above the high of the time range between 11.00 AM (21st 5 candle of the day) to 02.00 PM (57th 5 candle of the day).
2.) Similarly the price was in between the lower and upper Bollinger bands for the time range between 11.00 AM (21st 5 candle of the day) to 02.00 PM. and
3.) latest 5 minute close is crossing above the close of 1 candle (5 minute) back
Please explain the method or share a readymade sample scan satisfying above conditions.
Regards,
Sure, this is possible. Below is your scan:
https://chartink.com/screener/scan-for-pk-srivastava
Sir
My second condition is mot fulfilling in this scan…
.
.
2.) Similarly the price running was in between lower and upper Bollinger bands for the time range between 11.00 AM (21st 5 minute candle of the day) to 02.00 PM (57th 5 minute candle of the day) .
.
.
please rectify accordingly.
Hi, How can I apply Scans to Watchlist I have created?
You may select the same from the drop down menu. By default, it is set to “cash” segment. If you are not a premium member, you may select the watchlist as “default” and apply the same.
Hi,
How to get the last updated stock, when we refresh the page if the count increases its difficult to get the latest updated stock . Kindly reply
If you have created an alert for the scan, you can view the list of stocks tirggered along with the time stamp here: https://chartink.com/alert_dashboard
Dear Sir,
I want to make a screener which filters exact crossover. That filters all stocks in which 7MA crosses above 21MA or VWAP crossed close price of stock.
Hello,
Here is your scan:
https://chartink.com/screener/7ma-crosses-above-21ma-or-vwap-crossed-close-price-of-stock
Request to confirm why Open interest Put to call or Put to call volume ratio is not available or is there any way to create
Hello,
Currently, we support only NSE cash stocks and indices. We do plan on adding others in the future. Shall keep you posted.
Hi
I couldn’t find any example on group functions GroupAvg and other can you share a basic example of how to use these ?
Thanks
AK
Hello,
Currently, group functions are used in the Atlas dashboard only.
Below is an example dashboard view:
https://chartink.com/dashboard/71146
Quick question Team.
The “Market cap” values are as of what date ? And I assume they are in Crores.
Kindly confirm.
Thanks !
As of current date, yes, in crs
Hi can you please explain what exactly Max function does in scanner?
Hello,
MAX ( ) will return the largest value in a given list of arguments so that we can compare.
Below is an example scan:
https://chartink.com/screener/15min-close-greater-than-maximum-of-last-70-candles-of-15min
Sir,
i want to say that chartink is good for the all type of trader …it is very heplful for me and all other users.
but i want some information about chartink and please clear my some doubt
1.) please help me to lock my profit it means provide tp and sl scanner.
Nice to hear that. You may create a watchlist with your holdings and can add a condition to check if current price is down by 1-2%
Hi,
Can you please let me know if the below EMA Bounce strategy can be implemented here?
MovAvgExponential(“length” = 18) is greater than MovAvgExponential(“length” = 50) and
MovAvgExponential(“length” = 50) is greater than MovAvgExponential(“length” = 100) and
MovAvgExponential(“length” = 100) is greater than MovAvgExponential(“length” = 200) and
low from 1 bars ago crosses below MovAvgExponential(“length” = 18) and
MACDHistogramCrossover(“fast length” = 18, “slow length” = 50, “crossing type” = “Negative to Positive”) is true within 15 bars and
MACDHistogramCrossover(“fast length” = 50, “slow length” = 100, “crossing type” = “Negative to Positive”) is true within 15 bars and
StochasticFull(“over bought” = 70, “over sold” = 30, “k period” = 5, “d period” = 3, “average type” = “EXPONENTIAL”).”FullK” is less than or equal to 30 within 3 bars and
open from 1 bars ago is greater than MovAvgExponential(“length” = 18) and
close from 1 bars ago is greater than MovAvgExponential(“length” = 18) and
close is greater than high from 1 bars ago and
close is greater than open
Each bar is of 1 day interval. Can you please see if this is possible. Thank you much.
Sure, can you please email this requirement at [email protected]
Hello ,
My requirement is:
1. Add high of candles, whose change is greater than 2% from previous candle on conditional basis.
2. Add low of candles, whose change is less than 2% from previous candle on conditional basis.
3. Compare either sum of step1 > step2 or not. And show filtered stock.
Currently, this would not be possible.
Dear chartink team
I am using your scanner to filter out stocks and very happy to get this service that too free. I am very much thankful to you for the excellent service.
Now my question is ” how we can see that the filtres (esp. technical) visible in the stock chart.”?
Dear chartink team
I am using your scanner to filter out stocks and very happy to get this service that too free. I am very much thankful to you for the excellent service.
Now my question is ” how we can see that the filtre(s) applied esp. crossover (esp. technical) visible in the stock chart which has been screened ” ?. This will help in learning and modification in programming to get required stocks. as per our requirement. It will strengthening the screening.
Regards
Currently, it does not automatically apply on the chart, you will need to manually select the indicator and plot the same.
Hello sir
Is there any way to find 52 week high crossed by a share 2 or 3 times in a month time
Hello,
Here is your scan:
https://chartink.com/screener/52-week-high-crossed-by-a-share-more-than-2-times-in-a-month
hi Team,
Need help to create a scan where first 15 minute candle low meets the latest pivot ,supertrend in buy mode and also the first 15 minute candle low meets or equals to 50 dma .
Hello,
Here is your scan:
https://chartink.com/screener/1st-15min-low-meets-the-latest-pivot-supertrend-candle-low-meets-or-equals-to-50-dma
do you support algo trading? if yes, then how? if no, then by when can we expect it?
Hello,
We do have Webhooks for API that you can use to trigger events in your own system, https://chartink.com/articles/alerts/webhook-support-for-alerts/
Note on automating trades with webhooks, requires some programming logic so that you can incorporate our webhooks within your application which is already using API’s from the stockbrokers to place orders. Your system/application must be deployed on the internet and reachable by a domain or an IP address, this requires your application to support the ability to receive incoming POST request’s so that we can send our JSON data for the alert
We recommend using a service like Hookbin to test the webhooks feature, it allows you to create an endpoint, which you can add in our “webhook url” field within the alert form. An HTTP POST request will be made to the URL you have specified along with the data corresponding to the alert.
do you have any working example for the same?
Hi Team,
Please help me find out the second largest “high” of the last six months…
Hello,
Currently, this is not possible.
For one of my scanner, I need to make sure that 200 EMA is in uptrend.
i.e. todays EMA> yesterdays EMA > day before that EMA
For that I have made following three scanners.
All yielding slightly different results.
Not sure which is correct though.
can you please have a look and provide your inputs?
1.
Latest EMA (Latest Close, 200) Greater Than Latest EMA (1 day ago Close, 200)
Latest EMA (1 day ago Close, 200) Greater Than Latest EMA (2 days ago Close, 200)
Latest EMA (2 days ago Close, 200) Greater Than Latest EMA (3 days ago Close, 200)
2.
Latest EMA (Latest Close, 200) Greater Than 1 day ago EMA (1 day ago Close, 200)
1 day ago EMA (1 day ago Close, 200) Greater Than 2 days ago EMA (2 days ago Close, 200)
2 days ago EMA (2 days ago Close, 200) Greater Than 3 days ago EMA (3 days ago Close, 200)
3.
Latest EMA (Latest Close, 200) Greater Than 1 day ago EMA (Latest Close, 200)
1 day ago EMA (Latest Close, 200) Greater Than 2 days ago EMA (Latest Close, 200)
2 days ago EMA (Latest Close, 200) Greater Than 3 days ago EMA (Latest Close, 200)
Hello,
Here is your scan:
https://chartink.com/screener/today-ema200-greater-than-1day-ago-ema200-greater-than-2days-ago-ema200
( {cash} ( latest ema ( latest close , 200 ) > 1 day ago ema ( latest close , 200 ) and 1 day ago ema ( latest close , 200 ) > 2 days ago ema ( latest close , 200 ) ) )
Thank you for clearing the confusion..
krishna sahu
Dear Sir
Kindly find my below requirement
Daily time frame
Latest close greater than 50 simple moving average within range of 2%
And 200 simple moving average range within 5%
I hope you understand my requirement
Thanks and regards
Krishna
Reply
Hello,
Here is your scan:
https://chartink.com/screener/latest-close-greater-than-50sma-within-range-of-2-and-200-sma-range-within-5
How do I add stock name to my query? I want to execute the query on limited stocks only.
Hello,
You may create a watchlist for specific stocks here (https://chartink.com/watchlist/create) and run the scan against the watchlist. In the free version, one can run a scan only on the default watchlist and not others.
Hi Support
I have taken Premium membership.
Can you please share how to create one minute volume breakout with average percentage.
Hello,
Here is your scan:
https://chartink.com/screener/current-1min-volume-is-greater-than-last-10min-average-volume-by-1
Plz show time of the trade too alongwith the date irrespective of the time period of backtest history.
Also allow backtest history to be selected to any time frame irrespective of the time period of the filter; i dont think u need to show minimum 9 months result when using 1 month time frame in filters.
For the monthly candle, backtest goes back a long way. upto 20 years.
Hi sir
How to SCAN ALL TIME HIGE BREAKOUTS
Hello,
Currently, we do not have all-time high feature. For now, we need to enter the previous “n” number of candles to check current candle breaks it or not:
Here is an example scan:
https://chartink.com/screener/current-price-is-greater-than-52weeks-high
Hi sir
How to SCAN ALL TIME HIGE BREAKOUTS
Dear Sir
Kindly find my below requirement
what is meaning of bracket value
and how to use bracket value
please give example if possible on Daily time frame and
greatest fields also
I hope you understand my requirement
Thanks and regards
Krishna
Reply
Hello,
We calculate/compute math operations from left to right and don’t follow BODMAS. In such a case, if you want to bind a specific mathematical operation perform first. You can use the bracket() function.
Here is an example for bracket function:
https://chartink.com/screener/example-of-bracket-function
Plz show time of the trade too alongwith the date irrespective of the time period of backtest history, like “12-08-2021 9:30am”.
Hello,
Currently, it is not possible in the backtest. If you have set alerts for a scan, you may view the list of stocks triggered along with the time stamp here: https://chartink.com/alert_dashboard
hi
i want to know
A day first candle or any candle 15 min high break with new high and this high break new high
and same in low break as above
Hello,
Here is your scan:
https://chartink.com/screener/15min-close-price-is-at-days-high
Dear Chartink team,
I am looking to evaluate the percentage difference between 20EMA and 10EMA.
I have written a query but it keeps loading and does not show any output.
I can share my query with you please help me out on evaluating the percentage difference between 20 and 10 EMA
Hello,
Here is your dashboard view:
https://chartink.com/dashboard/74051
there is no filter of standard deviation of vwap, or rsi, or any other indicator
can you add intraday momentum index
can you add AND, OR, IF-ELSE
Kindly update Nifty 200 List. Motherson Sumi is no longer part of Nifty 200 as per latest NSE200 list.
Hi, I would like to write a query to find a stock whose weekly 10 WMA crossed below weekly 14 WMA in the last 5 days. can you please help
Hello,
Here is your scan:
https://chartink.com/screener/wma10-less-than-wma14-for-a-week-or-for-5days
How to find all the stocks >= 200 Price
Hello,
Here is your scan:
https://chartink.com/screener/stocks-greater-than-equal-to-200-price
the hourly time frame backtest gives results of time as 9:15 10:15 11:15 etc instead of at the exact time when that condition was completely met. please fix this
Hello,
Backtest always displays the starting time of the candle and not the time alerts are triggered.
If you have set alerts for a scan, you may view the list of stocks triggered along with the time stamp here: https://chartink.com/alert_dashboard
how to start automatic trade i can not know your portal so pls help me
contact no-9555345164
Hello,
Currently we provide only email support, please feel free to share your doubts here.
We do have Webhooks for API that you can use to trigger events in your own system, https://chartink.com/articles/alerts/webhook-support-for-alerts/
Note on automating trades with webhooks, requires some programming logic so that you can incorporate our webhooks within your application which is already using API’s from the stockbrokers to place orders. Your system/application must be deployed on the internet and reachable by a domain or an IP address, this requires your application to support the ability to receive incoming POST request’s so that we can send our JSON data for the alert
We recommend using a service like Hookbin to test the webhooks feature, it allows you to create an endpoint, which you can add in our “webhook url” field within the alert form. An HTTP POST request will be made to the URL you have specified along with the data corresponding to the alert
Also, I’ve come across 2 open source projects on Github to auto this workflow:
https://github.com/bogadib/chartink_kite_amo_mean_reversion
https://github.com/sumit12dec/algoconvention
Hope this helps.
can you add time frame for pre market hours
so that morning before market opens we will get results of our scanat the time of market opens
Dear Sir
my two requirement
NO(1) monthly time (20.50.100.150.&200 )Ema
all ema very close to each other
NO (2) Daily time Rsi positive divergennce
I hope you understand my requirement
Thanks and regards
Krishna
Sir,
the user guide is very old and also not updated as per latest attributes etc,can you update to latest 1,
thanks
will these scanners will filter based on live market CMP right. we can believe this
Hello,
In free version data is delayed by 5 minutes. In a premium subscription, charts and scans are updated every minute. Our premium members get realtime data with updates every minute for our Charts & Scans. So if you run a scan at 9:20am for example, it would be based on the latest data until 9:19:59am and so on..
Know sure thing KST indicator is not available on scanner, pl. add it
Hello,
This is possible using the formula. Below is an example scan for the same:
https://chartink.com/screener/kst-indicator-crossed-above-zero-for-daily
How to we identify stocks that are trading within 0.01% area of day’s high or low. Can we do that?
Hello,
Here are your scans. Kindly review:
https://chartink.com/screener/stocks-that-are-trading-within-0-01-of-it-s-day-s-high
https://chartink.com/screener/stocks-that-are-trading-within-0-01-of-it-s-day-s-low
Dear Sir
my two requirement
NO(1) monthly time (20.50.100.150.&200 )Ema
all ema very close to each other
NO (2) Daily time Rsi positive divergennce
I hope you understand my requirement
Thanks and regards
Krishna
Hello,
Here are your scans:
1) https://chartink.com/screener/monthly-time-20-50-100-150-200-ema-all-ema-very-close-to-each-other
2) https://chartink.com/screener/rsi-divergence-daily-bullish
I have created a scanner but I don’t want to scan from all stocks or from predefined options like nifty50, nifty100 etc, I want to scan from F&O stocks but i didn’t find any option for same. Is there any option to scan from f&o stocks or do i need to manually add those stocks to scan from? If I ave tp do it manually then how to add the list of stocks from whick i want to scan from?
1. How can we change all timeline, i.e. from weekly to daily or daily to hourly, is there any shortcut?
2. How can we reverse all the parameters, i.e. from less than to greater than etc etc.
Please give short cut of them, so that in case of changing all of them, just applying shortcut would do.
Also I would like to change the look out of scanner home page, instead of big fonts and wide space between columns,
1. hiding the clause contents
2. instead of another pages, continuing showing all scans like we do in mails
would not only fresh up the view but we would also see all scans and save our time surfing pages.
Thanks.
I want to filter out symbols provided in this link (https://zerodha.com/margin-calculator/Equity/ ) as my scan output .Is there a way to achieve it ?
can i make such scanner?
(close price day after ex-dividend day)/(close price on ex-dividend day)<1
Hello,
Currently, this is not possible.
Hi All,
When I create a new scanner based on some combination of parameters and Run the scan , the result will have some stocks with positive & change and some with Negative % change …pl suggest how to interpret this result…Suppose if My scanner is to find bullish stocks and if the scanned results has few stocks with positive % change and few with negative % change…how to interpret this ??
Dear Support,
Unable to scan from two different watchlist. Added 2 watch list and at a time only once is available to run scan.
Please suggest how to use 2 different watchlist in 2 different scanner.
Hello,
In the free version, one can run a scan only on the default watchlist and not others.
Dear Sir,
Absolutely amazing app! Hats off to you!
Do you provide same screening capability onto US or EU stocks as well?
If not, have you any plans to do so?
Andr0
Hello,
Currently, we support only NSE cash stocks and indices. We do plan on adding others in the future. Shall keep you posted.
Please 🙂 Thank you and Congrats!
i would like to create scan that can give me stocks whose latest close is greater than any monthly high that brakes upper BB.
Hello,
Here is your scan:
https://chartink.com/screener/latest-close-is-greater-than-any-monthly-high-that-brakes-upper-bb
How to save my created screener.
Hello,
Click on the green button named “save scan” give the name to the scan and click on the “submit” button. You can see your saved scan here: https://chartink.com/scan_dashboard
can you explain the difference between these:-
1. [0] 5 minute SMA ([0] 5 minute Close, 20)
2. [1] 5 minute SMA ([0] 5 minute Close, 20)
3. [0] 5 minute SMA ([-1] 5 minute Close, 20)
4. [-1] 5 minute SMA ([-1] 5 minute Close, 20)
i am basically trying to understand these two time frames in one part of the condition
correction
2. [-1] 5 minute SMA ([0] 5 minute Close, 20)
Hello,
Here is the explanation:
[0] 5 minute SMA ([0] 5 minute Close, 20)
:- average of 20 candles close of 5min-timeframe from current candle
[-1] 5 minute SMA ([0] 5 minute Close, 20) AND [0] 5 minute SMA ([-1] 5 minute Close, 20)
:-average of 20 candles close of 5min-timeframe from 1 candle ago
[-1] 5 minute SMA ([-1] 5 minute Close, 20)
:-average of 20 candles close of 5min-timframe from 2 candles ago
Hi,
[-1] 5 minute SMA ([-1] 5 minute Close, 20)
:-average of 20 candles close of 5min-timframe from 2 candles ago
this is bit confusing, what is the need of putting offset value inside the bracket i.e [-1] 5 minute Close, 20??
Hello,
It is not necessary. You can put either inside or outside to avoid confusion.
For Example:
[-2] 5 minute SMA ([0] 5 minute Close, 20)
Or
[0] 5 minute SMA ([-2] 5 minute Close, 20)
Hi Team can u please code for me first 15 days of the month there should be no open equal to low should not been happened. example this month september from day first 15 days open equal low should not been happened. Team can you please help me on this. Thanks…
Hello,
Currently, it is not possible. For now, we can check “n” number of days ago last 15 days open is not equal to low.
Hello
Is there a way to find whether
7 day sma to 21 day sma crossover happened or not since last 14 days
Hello,
Here is your scan:
https://chartink.com/screener/7-day-sma-to-21-day-sma-crossover-happened-or-not-since-last-14-days
Hi is it possible to use variable,
Lets say i want 2 things
a = Max(54,weekly High)
and “b” i want which week high was it
Regards
Currently, “b” is not possible. We can check if current close is greater than previous 54 weeks high
Sir,
find stocks whose 0-5% difference between cmp on 20 days high.
Hello,
Here is your scan:
https://chartink.com/screener/stocks-whose-0-5-difference-between-cmp-on-20-days-high
I want following scans –
1) Stocks opening above weekly camarilla H3 or Below L3
2) Last 15 min/ 30 min candle breakout weekly camarilla H3 or brekdown weekly Camarilla L3
3)Scan which gives list of Stocks that are trading above weekly camarilla H3 or weekly Below L3 when I run that scan i.e. any time
4) Last 15 min/ 30 min candle breakout weekly camarilla H4 or brekdown weekly Camarilla L4
Hello,
Here are your scans:
1. https://chartink.com/screener/stocks-opening-above-weekly-camarilla-h3-or-below-l3
2. https://chartink.com/screener/stocks-close-above-weekly-camarilla-h3-or-below-l3-15min
3. https://chartink.com/screener/stocks-close-above-weekly-camarilla-h3-or-below-l3-30min
4. https://chartink.com/screener/scan-which-gives-list-of-stocks-that-are-trading-above-weekly-camarilla-h3-or-weekly-below-l3
5. https://chartink.com/screener/stocks-close-above-weekly-camarilla-h4-or-below-l4-15min
6. https://chartink.com/screener/stocks-close-above-weekly-camarilla-h4-or-below-l4-30min
Hello Sir,
In the above scans, the stock which closed below L4 is not scanned. It shows “No Stocks filtered”.
Can we scan MCX -Commodities like Gold, Crude, Silver through chartink?
Hello,
Currently, we support only NSE cash stocks and indices. We do plan on adding others in the future. Shall keep you posted.
any update on this?
Hello,
Currently, it is not possible to give an ETA for the same. We shall keep you posted.
Dear Team,
This is extension to previous query.
Pls help me code below given cases.
Consider 15min chart.
CASE 1 :
If current candles CLOSE (GREEN CANDLE) is above 10 EMA then the difference between current candle CLOSE and 10 EMA should be less than or equal to 0.25% of STOCK PRICE.
CASE 2 :
If current candles CLOSE (RED CANDLE) is below 10 EMA then the difference between current candle CLOSE and 10 EMA should be less than or equal to 0.25% of STOCK PRICE.
Pls reply me.
Hello,
Here are your scans:
https://chartink.com/screener/close-above-10-ema-difference-between-currentclose-and-10-ema-less-than-or-equal-to-0-25
https://chartink.com/screener/close-below-10-ema-difference-between-currentclose-and-10-ema-less-than-or-equal-to-0-25
Thank you very much….:)
Dear Team,
Pls help me code following condition.
Condition : Consider 1 hour Chart.
The difference between current candles CLOSE and WEEKLY PIVOT POINT should be less than or equal to 0.50% of STOCK PRICE.
Awaiting for ur reply.
Hello,
Here is your scan:
https://chartink.com/screener/difference-between-current-candles-close-and-weekly-pivot-point-less-than-or-equal-to-0-50
Hello,
Here is your scan:
https://chartink.com/screener/difference-between-1hour-close-and-weekly-pivot-point-less-than-or-equal-to-0-50
How to exclude banking stocks or financial stocks
Hello,
Here is an example scan:
https://chartink.com/screener/exclude-futures-stocks-out-of-nifty-500-stocks-list
You can create a watchlist for banking stock and run it as a “fails all” as you can see in the scan.
Hi Team ,
Is there a way to detect % change since last EMA7 to EMA20 crossover whithin this month.
Thanks in advance
No, currently, this is not possible.
Hello Sir,
I am using the scanner of Supertrend positive breakout and VWAP separately and getting good results, How can I add the filter in the same scanner to alert me when the trend is reversing. Please help me.
Hello,
Here is your scan:
https://chartink.com/screener/close-crossed-below-supertren-7-3-and-close-less-than-vwap
I want following scans –
1) 5 Min Candle is above Camarilla H4
2) Today Camarilla H3 is Less than equal to Yesterday Camarilla H3
3)Today Camarilla L3 is Less than equal to Yesterday Camarilla L3
I want following scans for Nifty 100
1) Stocks 5 Min Candle is below Camarilla L4
2) Today Camarilla H3 is Less than equal to Yesterday Camarilla H3
3)Today Camarilla L3 is Less than equal to Yesterday Camarilla L3
I want following scans for Nifty 100
1) Stocks 5 Min Candle is higher Camarilla H4
2) Today Camarilla H3 is Less than equal to Yesterday Camarilla H3
3)Today Camarilla L3 is Less than equal to Yesterday Camarilla L3
Hello,
Here is your scan:
https://chartink.com/screener/stocks-5-min-candle-is-higher-camarilla-h4
Hello team Chartink
please do help me with a new scan which on a daily candle basis the sma 34 goes on /ranges between the open close of a bullish / green candle PlUS Also can you add if possible another 2 similar scan when SMA 34 is in UPTREND/or sideways
thanking you
Can you please share an example chart image on [email protected]?
I want to subscribe for live scans and alerts. What is the procedure? Is any mobile response available to contact customer care / chartink support in case of any problem.
Hello,
Currently, we provide only email support, please feel free to share your doubts here.
You can get details/signup our premium service here: https://chartink.com/subscription
As a premium member you would be able to:
Access realtime data for Charts & Scans every minute
Create Alerts and receive updates of stock breakouts over sms/email/mobile/desktop/webhooks
View charts in 1/2/3 minute timeframes with auto-refresh
Run screeners in 1/2/3 minute timeframes with auto-refresh
Scan any watchlist via the segment dropdown of a scan
Set scans to private
Customized Atlas dashboards for market overview
Get Dedicated support for your scanner requirements
sir, how we can export a scaned list of shares into watchlist to apply another scan
Hello,
We can save the results of a scan into a watchlist in Atlas dashboards and have the watchlist run on another widget/scan. For the watchlist to update during market hours, you will need to keep the Atlas dashboard page open. Currently, alerts are not sent out of Alta’s dashboards. We do plan on adding this feature soon.
Hello ChartLink,
I want to check – if my Stock price is cross above or below – of one specific time period e.g. when price cross the high of market start to 10am – i can find that using my scanner. I can use 5min 10 candle logic – but i want always – during complete day – only those fixed Days’s first 10candle’s High & Low value – crossover
Is it possible to get ?
Hope the below scan helps:
https://chartink.com/screener/5-min-close-greater-than-days-first-10-candles-high
I have opted premium subscription and amount debited ,still on the subscription tab its showing payment failed . I have sent multiple mails with payment screen shot but no response from the team and till now its not activated .There is no confirmation on the same . Very poor service .
Hello,
We have replied to your query by email. Hope you have received it.
sir how to find days nth candle
Hello,
Currently, we can enter the previous “n” number of candles in the scan and check the results. For Example Previous 5 candles ago in 15min timeframe, the previous 20 candles in 30min timeframe and so on..
If you need help in creating a scan, please share your scan requirements and we shall create the same for you.
Hello,
How to filter out shares trading 2% below or above of .786% Fibonacci extension or Fibonacci retracement.
Thanks
Hello,
Here is your scan:
https://chartink.com/screener/shares-trading-2-below-or-above-of-786-fibonacci-retracement
How we can create our own segment so that we scan only those stocks which are filtered out from another Scan?
Hello,
We can save the results of a scan into a watchlist in Atlas dashboards and have the watchlist run on another widget/ scan. For the watchlist to update during market hours, you will need to keep the Atlas dashboard page open. Currently alerts are not sent out of Altas dashboards. We do plan on adding this feature soon
E.g.
1 day ago Close < [=1] 1 hour Open
I need some guidance to understand the Days Nth Candle. If we see in the above example it is defined as [=1]
Does this mean that we are scanning to stocks whose 1 days ago close is less than todays 1st 1 hour Open or the Latest 1 Hour Open?
Your help is much appreciated.
Hello,
1 day ago Close < [=1] 1 hour Open In the above filter, you are comparing the 1day ago close with today's first candle of 1 hour open.
Yes
Hello,
If so, You are referring to the right code.
Hello team,
Pls help me sir to code below given requirement
SMA 50 AND LOWER BOLLINGER BAND TOUCH TO THE CANDLE ON DAILY { ONE DAY } CHART
SMA 50 AND UPPER BOLLINGER BAND TOUCH TO THE CANDLE ON ONE DAY TIME FRAME
Hello,
Here are your scans:
1. https://chartink.com/screener/candle-touches-the-lower-bb-and-sma50-in-daily-tf
2. https://chartink.com/screener/candle-touches-the-upper-bb-and-sma50-in-daily-tf
May I please get a logic/scanner for below requirements
everything on 3 mins TF –
3min 20EMA > 100EMA
and 13EMA crossover above 20 EMA (basically the exact point where 13EMA>20EMA>100EMA)
provided avg volume of last 22 days is above 30K
Hello,
Here is your scan:
https://chartink.com/screener/13ema-20ema-100ema-avg-volume-of-last-22-days-is-above-30k-3min-tf
FOUND OUT OF FORMULA STOCK “WIPRO” LAST IN LIST .
PLEASE CONFIRM
Hi
Is it possible to plot a scanner for stocks which are opening on a SMA 44 where SMA 44 and SMA 200 both are rising…
thanx
Hello,
Here is your scan:
https://chartink.com/screener/stocks-which-are-opening-on-a-sma-44-where-sma-44-and-sma-200-both-are-rising
Hi,
Is it possible to have the “N Candles Ago” field setup as a variable.
Also a function to calculate what Day of the Week it is today and What Time it is currently.
Looking to build a scanner that looks at a particular candle and it stays the same every time the scanner is run. So that the same scanner can be run anytime from Monday till Friday.
for e.g. Check if the high made during the first hour of the week has been crossed over anytime during the week after that.
Thanks.
Currently, we do not have this feature. However, we may plan on adding it in the near term & l shall keep you posted on this.
Hi
is it possible to find out the angle of daily candles after 20/50 ema crossover.
Thanks
Currently, this would not be possible.
want to scan opening is more than 5% than previous day close
Hello,
Here is your scan: https://chartink.com/screener/open-greater-than-previous-day-close-by-5
In all my scans would like only F&O stocks.
Hello,
You can select the “future” segment from the dropdown list.
Please note:
Currently, we support only NSE cash stocks and indices, we have created a segment group named ‘futures’ to scan stocks that are traded in the F&O group. If you select futures, scanning will be done on basis of cash stock prices/ values.
Sir free scanner main 15min ke bad alert aata hai
Is any difference between paid or free
Hello,
Currently alert is a premium feature.
Free version data is delayed by 5 minutes. In a premium subscription, charts and scans are updated every minute. Our premium members get realtime data with updates every minute for our Charts & Scans. So if you run a scan at 9:20 am, for example, it would be based on the latest data until 9:19:59am and so on…
As a premium member, you would be able to:
Access realtime data for Charts & Scans every minute
Create Alerts and receive updates of stock breakouts over SMS/email/mobile/desktop/webhooks
View charts in 1/2/3 minute timeframes with auto-refresh
Run screeners in 1/2/3 minute timeframes with auto-refresh
Scan any watchlist via the segment dropdown of a scan
Set scans to private
Customized Atlas dashboards for market overview
Get Dedicated support for your scanner requirements
You can get details/signup our premium service here: https://chartink.com/subscription
LATEST OPEN GRETER THAN EQUAL TO LATEST OPEN * NUMBER 0.97
HERE WHAT IS ACTUAL MEANING OF NUMBER 0.97 ??
Hello Team
How to find the stocks where the 50 days EMA and 200 days EMA are very close to each other i.e. near intersection .
Hello,
Here is your scan:
https://chartink.com/screener/50-days-ema-and-200-days-ema-are-very-close-to-each-other-i-e-near-intersection
Dear Team,
How can we identify stocks with relative strength against the performance of Nifty 50 or any other index for weekly time frame?
Hello,
Currently, we do not have these features. However, we may plan on adding it in the near term & l shall keep you posted on this.
Appreciate your prompt and honest reply. Please do develop utility on RS at earliest.
Regards,
Hello,
We are working on the same. Shall keep you posted.
Chartink is a great tool. Keep it up.
I have read few comments here around RS (Relative Strength). Just wanted to know if you managed to add that feature and if not, are there any timelines that you can share please. RS feature will be a massive addition.
Hello,
Currently, it is not really possible to give an ETA on the same. Shall keep you posted.
Hi,
I am trying to understand how bracket function works at raw level. Can you please tell me what is return value of bracket function if possible with raw example? I just want to know technical specification of bracket function. It will be great help if you have technical specification of each function supported by chartink.
Please help.
@Chartink Support please help.
Hello,
Thank you for reaching out. Please do let us know how we may assist you?
Please see my original question. Coping it here again.
I am trying to understand how bracket function works at raw level. Can you please tell me what is return value of bracket function if possible with raw example? I just want to know technical specification of bracket function. It will be great help if you have technical specification of each function supported by chartink.
Hello,
The bracket function is used to control the order of the operations. As we do not follow BODMAS, all the mathematical operations will be carried out from left to right. So a simple example would be 2+10*2. Writing this will give you a result of 24 whereas if you control the operation by using BODMAS, you will write it as 2+(10*2) and this will give you a result of 22. I hope this helps.
can you contact me 8979524478
i want to know how chartlink screener use
Hello,
We provide support only via email, as it makes it simpler for us to understand your requirements & have them documented; hence I suggest you please try to share your requirements here.
Free version data is delayed by 5 minutes.
In a premium subscription, charts and scans are updated every minute. Our premium members get realtime data with updates every minute for our Charts & Scans. So if you run a scan at 9:20 am, for example, it would be based on the latest data until 9:19:59am and so on…
We provide dedicated scanner support to our premium members which allows you to send your scan requirements and we create and share the scan with you. You review examples scans or create your own scan by following our scanner guide here.
Best technic
Hello,
Could you please elaborate on your query?
Inhave subscribed monthly
How domingetbthe confirmation and activation of alert
Hello,
We have received your email with this query and have reverted as well. I hope you received our response.
under “select a segment”, does the ‘future’ consists of options too or only futures? like if i want to run some test on call/put options of nifty, then how to do that?
Hello,
We currently support only NSE cash stocks and indices; we have created a segment group named ‘futures’ to scan stocks traded in the F&O group. If you select futures, scanning will be done based on cash stock prices/ values.
any chance you will be including the call and put too? that will be really great
Hello,
Currently, it is not really possible to give an ETA on the same. We plan to add it soon. I shall keep you posted.
hi sir = I want to scan stocks breakout dynamic zone . share highest price breakout example Greaves Cotton Limited breakout price 177rs please help me sir
Hello,
Please let us know what conditions you want within the scan to capture the demand zone so we can accordingly help create the same for you.
I have a query: how to scan 3 candles at a time(c1,c2, c3) .
example: c2 high is lower than c1 high and c2 low is lower than c1 low and
c3 high is less than c2 high and c3 low is lower than c2 low.
I need to scan candles based on 15 min interval.
Is it possible with chartink ?
Hello,
Thank you for reaching out. Here is your scan, kindly review:
https://chartink.com/screener/current-high-less-than-last-2-candles-high-and-current-low-less-than-last-2-candles-low-15-min-tf
Thank you for providing this scanner.
However, I’m trying to filter stocks based on Price and added below filter to your scanner:
Price to Book value Greater Than Number 200
It is not returning any stock although it should. What is wrong in it? I want to see stocks which are more than 200 with above scanner.
Hello,
Here is your scan for the stock price, greater than 200 and more. Kindly review:
https://chartink.com/screener/price-greater-than-200-and-more
This is not working as intended. When I see 15 min graph of screened stocks, candles does not fall into the category mentioned.
Can you have a look into it again ?
Hello,
You can modify the timeframe from “Latest” to “[0]15min” to see the results for 15min timeframe like- [0] 15-minute Close >= 200
I have modified scanner as suggested and saved it as VipTesting, but it is not reflecting candlestick pattern what we intended for. I’m unable to attach screen shot here.
Latest 3 candles should follow following pattern:
|
| |
| | |
| |
|
Although the scanner which you created is logically correct but it is not giving above pattern. What’s wrong in it ?
Thank you for all your help in advance!
hi , is this a sell scan? kindly tell me as i was also checking the scan , regards
Are you referring to scan: https://chartink.com/screener/price-greater-than-200-and-more ?
This scan simply checks if current price of the stock is greater than 200rs.
how to copy paste code of scanner
Hello,
You can copy the code of a scan by clicking on the “copy group to clipboard” option in the very 1st line of the scan, which starts with “Stock passes all…”. Similarly, you can paste the code in another scan by clicking on the “paste copied filters/groups” option, which is at the bottom of your scan conditions next to the “green plus sign”, I hope this helps.
is there volume traded per day filter i am not able to find it
Sure, please share your conditions and we shall create the same.
3 to 4 % Gap up and gap down candles
Hello,
Here are your scans:
https://chartink.com/screener/3-to-4-gap-up-stocks
https://chartink.com/screener/3-to-4-gap-down-scan
How to make scanner monthly and weekly Rsi above 60 and taking support on 40 please let me know thank you
Hello,
Could you please share the chart image for the same for reference?
Hey Chartink Team,
I was wondering whether we can create a scanner in which stocks pass a certain criteria but it is contingent upon index screening. For ex – a stock’s RSI crosses above 50 and also NIFTY’s RSI is above 50
Hello,
Are you asking for a relative strength feature? If so, we do not have a Relative Strength feature. However, we may plan on adding it in the near term & l shall keep you posted on this.
how to minimize and maximize chart , i could not able to se + or – sign for that , pls help
Hello,
Currently, we do not have a zoom-in and zoom-out feature in our chart. However, we may plan on adding it in the near term & l shall keep you posted on this.
SIR PLEASE HELP ME TO CREATE A SCAN FOR LATES PRICE VOLUME TREND CROSSED ABOVE LATEST SIMPLE MOVING AVERAGE 30, THANK YOU.
Hello,
Here is your scan. kindly review: https://chartink.com/screener/latest-price-and-volume-is-crossed-above-sma30
Thank you for helping me sir, but i am looking for PVT INDICATOR[ Price volume trend ] crossed above 30period SMA [ Simple moving average ] , this PVT indicator is not our indicators list. it’s looks like RSI indicator but no over bought and over sold zones in it. plese help me to create for me . Thank you.
Hello,
It is possible using the formula. Below is an example scan for the same:
https://chartink.com/screener/price-volume-trend-crossed-above-30period-sma
THANK YOU VERY MUCH SIR.
Sir just now i tried to sceen using above SCAN, and the results i need PVT crossed above SMA 30 – PVT, but it showing in my Zerodha Kite – Chart IQ is different results like greater than SMA30-PVT, some stocks showing crossed bellow SMA 30 -PVT. I tried with many stocks but still i got same results. please sole my scanner problem. thank you.
Hello,
Here is a modified scan for the crossover, kindly review:
https://chartink.com/screener/price-volume-trend-crossed-above-30-period-sma-of-pvt
Sir still this screener [ on Dt:22/02/2022 created by you ] not work to scan PVT crossed above SMA-PVT-30. i don’t understand what is missing in it sir, i back tested use this scan , and i found some of few stocks between Rs.80 to Rs.1000 in NIFTY500 SEGMENT, on Date 14/02/2022 are those stocks names :- UFLEX, SUPPETRO, SEQUENT, ERIS, BDL, SOLARA, CGCL, FORTIS, KSCL, HOMEFIRST, GUJGASLTD. i cross checked and verified these stocks in Zerodha Kite – CHART IQ results are some GREATER THAN SMA -PVT 30, AND SOME LESS THAN SMA -PVT 30, but no one has crossed above it. so please fix this problem sir . thank you.
Hello,
Thank you for your email. I checked this against the stock “UFLEX,” and I do see the crossover taking place. Here is an image for your reference. I have plotted this on our Atlas dashboard and highlighted the 14th Feb PVT line as the “blue” line. Notice the previous line does show a crossover.
https://ibb.co/myhrStw
good morning sir , thank you for reply, just now i cross checked with UFLEX and other stocks which i had highlighted previously, the UFLEX ‘S PVT responds crossover due to the huge gapup, and one of the other stock responds crossover due to huge ‘spikesup’ , those rest of all stocks not showing any crossover results on the date of 14/02/2022 scanned by this screener. i visually cross checked those stocks using zerodha kite[ Price volume trend indicator is there ] . please veryfie all those stocks , and sole my problem sir , thank you.
Hi,
First of all, great work. It is a fantastic scanner for technical analysis I have ever seen.
May I know whether do we apply scan for Nifty Index only (not nifty stocks). Whenever, MACD gives cross over (above/below) on 15 mins charts and on a day chart, I want alert to be received.
Let me know if this is possible. If yes, I will buy the premium subscription of this application.
Regards,
Harsh Ganatra
Hello,
Here are your scans on the “nifty and bank nifty index segment”
https://chartink.com/screener/macd-cross-over-above-in-nifty-and-bank-nifty-index
https://chartink.com/screener/15min-macd-cross-over-above-in-nifty-and-bank-nifty-index
https://chartink.com/screener/15min-macd-cross-over-below-in-nifty-and-bank-nifty-index
https://chartink.com/screener/macd-cross-over-below-in-nifty-and-bank-nifty-index
what is number 0.98
Hello,
Ideally, this is used to check for 2% (below). For example, if we want to check for stocks that are less than yesterday’s close by 2% or below.
Sir Kindly give SMA Cross over( below or above) i.e SMA 5 crossed just crossed above SMA10
(2) SMA5 from below crossed above SMA-10.
Hello,
Here are your scans. Kindly review:
https://chartink.com/screener/sma5-crossed-above-sma10-in-daily-timeframe
https://chartink.com/screener/sma5-crossed-below-sma10-in-daily-timeframe
Sir
How to avoid repetition of same stock?
Hello,
Are you asking for a repetition of stock alerts?
You can set the alert setting being sent to unique that will send notifications for the same stock only once a day. You will be alert as per your alert notifications preferences.
The setting can be modified by clicking on the “Modify Alert” button right below your scan.
I want help in making a screener for EMA 20 below Heikin Ashi candle in 5 mins chart and at the same time MACD default crossover happens in 1hr timeframe instead of 5 mins timeframe of EMA 20. Is it possible?
Hello,
Here is your scan. Kindly review: https://chartink.com/screener/ema-20-below-heikin-ashi-candle-in-5-mins
if i want stock that move 20% in 5 day
all stock satisfying this criteria in 5 year time period
please help please
Hello,
I’m really confused here. I would like to screen for stocks for which 100 EMA crossed over above 200 EMA just yesterday, along with meeting other conditions.
I made this scanner, but it doesn’t work. It shows the stocks for which the crossover happened many days ago.
Could you let me know what I missed here, please?
https://chartink.com/screener/zapper-long-ema-100-200
Hello,
Could you please share with us an instance of what you are seeing so we can accordingly review and respond? You could also write to us @ [email protected]
Hello,
Could you please share an instance of where you can see the crossover happened many days ago? You can share the details via [email protected]
Hi
Whats the difference between:
1 day ago Ema ( Latest Close , 20 ) crossed_above 1 day ago Ema ( Latest Close , 50 )
and
1 day ago Ema ( 1 day ago Close , 20 ) crossed_above 1 day ago Ema ( 1 day ago Close , 50 )
Hello,
The difference is in the 1st condition it is considering the EMA 50 from 1 day ago whereas in the 2nd condition it is considering the EMA 50 value from 2 days ago since you have used “1 day ago” both inside and outside the EMA. I hope this helps.
Any timeframe say today from 9:15 till now (or a certain date till now), each of previous low (or high) to previous minus 1 high (or low) to previous minus 2 low (or high) is >0.9% of last (or average) price of the stock.
Thats basically 3 price movements of >0.9% of price each.
Can I scan for this?
Thanks
Hello,
We did receive a similar email from your end. I am sharing the scan here for your reference. I hope this is as per your expectation:
https://chartink.com/screener/percentage-greater-0-9-more-than-3-time
Sir , Please help me to create a SCANN for Latest Close CROSSED ABOVE previous swing LOWER HIGH. thank you.
sorry i mean :- Latest Close CROSSED ABOVE recent swing LOWER HIGH
Hello,
We can check if the current candle’s close is within 1.5% of the previous 25-30 candles high. Will this help?
May be it will be helpfull , lets try sir, please create for me above scan as you metioned. but my view is the down trend came to the end with Divergence { up trend reversal started while crossed RSI CROSSED ABOVE 30] ,while this uptrend is in pogress, the LATEST CLOSE CROSSED ABOVE recent SWING LOWER HIGH [ but in between the “swing lower high & latest close ” {“V” shape} those ‘N’number of candles doesn’t matter sir ]. IN SIMPLE FORM I WOULD SAY THIS WOULD BE UP TREND BREAKOUT CONFIRMATION AFTER COMPLETED THE DOWN TREND WITH DIVERGENCE, please help me sir .
Good afternoon sir,
Please help me to create a SCANNER based on ‘ WILLIAMS FRACRALS INDICATOR’.
i,e :- Latest CLOSE Crossed above UP FRACTAL
Latest CLOSE Crossed bellow Down FRACTAL
Thank you sir.
hi,
What is the significance of the function , Floor (Value)? Does it return the Integer Value of the called Function. Say if Latest ADX (14) is 20.75, if I use Floor (Latest ADX(14)), will the expression return a value of 20?
Hello,
The floor() function calculates the Floor of a numeric value. The Floor of a numeric value, say Value A, means the largest integer smaller than Value A if Value A is a floating-point number, or Value A itself if it is an integer.
In mathematics, result from using 1.5 against Floor will result like Floor (1.5) = 1
I hope this helps.
I have observed that most of the time Low greater than equal to Vwap does not work.
and it has problem with “Low” or “Greater than equal to” . could you please check this please.
Hello,
Please share the link to the scan where you noticed the issue with an example stock to review the same and respond.
Please help me implementing Fisher Transform custom indicator
https://www.investopedia.com/terms/f/fisher-transform.asp
Hello,
It is possible to create a custom indicator by using a formula. Here is an example scan for the same:
https://chartink.com/screener/ehler-fisher-transformation-eft-crossing-above-0
Thanks for your effort but it producing just one result which also seems wrong … can you revalidate the formula.
Screenshot of the tradingview indicator with result :
https://imgur.com/a/NQ58iie
Sorry for the confusion. Currently, we do not have this indicator. We do plan on adding it in the near future. Shall keep you posted.
HELLO,
I HAVE A SCANNER OF NARROW CPR, WHICH SHOWS STOCK WITH NARROW CPR FOR THE NEXT DAY,
ONCE I HAVE MY STOCK READY FROM THE SCANNER, IS IT POSSIBLE TO PUT THAT STOCKS IN OTHER SCANNER FOR NEXT DAY??
You will need to create a watchlist for the same and run the scan against the created watchlist. You may create a watch-list here: https://chartink.com/watchlist/create
Hi
How to get shares where [ daily rsi(14) crosses above Weekly Rsi(14) ] in last 10 days.
Thanks
Hello,
Crossed above or below function is not working for the multiple/two different timeframes.
We have tried to create a scan for the daily Timeframe. Here is a scan for Daily Rsi crossed above maximum RSI of the last 5days within the last 10 days. Kindly review:
https://chartink.com/screener/daily-rsi-crossed-above-maxinum-rsi-of-last-5days-within-the-last-10-days
Can i use 2 brackets together?
I want to build a scanner wherein I can use EMA (and not SMA) for calculating VWMA. And also HLC/3 is required for calculating VWMA and not only close.
latest close greater than (EMA ((high+low+close)/3*volume,20))/EMA(volume,20)
I am not able to put 2 brackets after EMA.
Hello,
Here is your scan. Kindly review:
https://chartink.com/screener/latest-close-greater-than-ema-high-low-close-3-volume-20-ema-volume-20
If you need help in creating a scan, please share your requirements, we shall create the same for you.
Hi,
I read through previous comments here regarding ” Round” function. i could not find a response. Hence stating my question here.
Is there a way we can specify how we want to “Round” a certain value? Currently i think “Round” function by default truncates the decimal places. But can we round to multiples of 10 say by specifying an additional variable say “-1” as we do in excel?
Is this possible currently (i dont think so)? Is this something that can be built?
Currently this would not be possible. Shall get with the team on your suggestion.
Hi , thanks for creating a fantastic platform which helps convert thoughts into realty.
Please , i need your support to build the below scanner which is OBR but includes price action.
1. Opening candle of 15 minute is the basis for this scanner.
2. Price action of 15 minute candles , minimum next 5 candles( 15 minutes each) after the opening candle must be inside the opening candle
3. Then any candle after 6th or beyond candle that breaks the opening range either side triggers a buy or sell.
4. Please can you help.
Many thanks for your support.
Hello,
Here is your scan. Kindly review: https://chartink.com/screener/5candles-of-15min-are-inside-the-first-candle-and-breakout-or-breakdowm-on-current-candle
Many thanks for getting back and sharing the scanner. Unfortunately , the result is not the best as a lot are missed out. I tried to make the below scanner which gives similar result but your scanner doesn’t, would need an expert review.
Please, can you look into mine and suggest improvement.
https://chartink.com/screener/obr-plus-price-action-new
Much appreciate your help and support
Hello,
Sure, you can use the min-max function to reduce the code. Here is a modified scan for days first 4 candles after 1st 15min candles are inside the first candle of 15min timeframe and the current close breaks the first 15min high or low: https://chartink.com/screener/obr-plus-price-action-new-modified
I hope this helps.
Hi,
How can we use any of these scanners for the US stock market?
Hello,
We currently support only NSE cash stocks and indices; we plan to add Global stocks and indices too shortly.
Hello
pl suggest any scanner for Monthly RSI and Weekly RSI above 60 and daily RSI above 50
Hello
pl suggest any scanner for Monthly RSI and Weekly RSI above 60 and daily RSI above 50
Hello
Thank you for reaching out. Here is your scan. Kindly review:
https://chartink.com/screener/monthly-rsi-and-weekly-rsi-above-60-and-daily-rsi-above-50
Hi,
I want to create a scan wherein the Number of Weekly closes above the R2 (Pivot Point R2) for the Current year is not more than 2. Can you please help me with the same
Hello,
Thank you for reaching out. Here is your scan; kindly review it-
https://chartink.com/screener/weekly-closes-above-the-r2-pivot-point-r2-for-the-current-year-is-not-more-than-2
Hi, Thanks for your response, But can you please clarify this, The Pivot Point R2 is specific to a Particular year, So if you consider 52 Weeks, Does it also check the condition for part of 2021 with respect to its Pivot point R2
Hello,
We’ve tried to adjust the scan using the count function within the weekly time frame. Kindly review it-
https://chartink.com/screener/weekly-closes-above-the-r2-pivot-point-r2-for-the-current-year-is-not-more-than-2
how to find only future and option stock
Hello,
We currently support only NSE cash stocks and indices; we have created a segment group named ‘futures’ to scan stocks traded in the F&O group. If you select futures, scanning will be done based on cash stock prices/ values.
sir can you help to create double bottom pattern scanner f
Hello,
Thank you for reaching out; here is your required scanner, kindly review –
https://chartink.com/screener/double-bottom-pattern-w-pattern
For more scanner requests, please email us at – [email protected]
I would like to develop a scanner where todays high should not be more than (open*1.25). Tried to make it but got wrong results.
Please help me with the sample for the same.
current scanner link which does not work properly: https://chartink.com/screener/intraday-short-2033
Hello,
Thank you for your comment. Do you mean you want to ensure the high is within 1.25% of the open? As multiplying open*1.25 would add 25% to the open value, kindly confirm.
Hi
I’m struggling to find/create a current scan to filter stocks that gained more in custom duration like Oct 2008 to June 2009.
Any help in this would be much appreciated. Thanks
Hello,
Thank you for reaching out. Currently, we do not have this feature of the scan to filter the stock in any specific time duration. However, we may plan on adding it in the near term & l shall keep you posted on this.
hi a want to develop OBV breakout or breakdown scanner.but unable to do it.kindly help
Hello,
Thank you for reaching out. Here are your scans. Kindly review:
https://chartink.com/screener/daily-obv-greater-than-zero
https://chartink.com/screener/daily-obv-less-than-zero
Good morning sir, please help me to create scanner for , when a stock is end of the down trend, latest candle close above the recent swing high [ lower high of the down trend ] and there should be ‘ v ‘ shape of candles chart pattern [ no matter how many candles exist’s in the ‘v ‘ shape. thankyou sir.
The ‘v’ shape candles pattern is in between Latest ‘close’ and the recent swing high [ Lower high of the down trend ]
Hello,
Here is an example scan, https://chartink.com/screener/v-share-recovery-scanner-on-daily-candles
The stock crossed the previous peak(Max high) after falling; I hope this helps.
THANKYOU VERY MUCH SIR.
Hello,
You are welcome; we are happy to help you.
hello,
can you please add other exchange markets like NASDEQ,NYSE ?
or advise how can we use these scanners for NON Indian markets.
Hello,
We currently support only NSE cash stocks and indices; we plan to add Global stocks and indices shortly.
Please give me scanner of all stocks which have (VWAP-50ema)>0.75%
Hello,
Thank you for reaching out. Here is your scan. Kindly review:
https://chartink.com/screener/differece-between-vwap-and-50ema-greater-tahn-0-75-in-daily-timeframe
Hello Ashwin,
Do you mean the difference between Vwap and EMA50 should be greater than 0.75% on the latest(daily) candles? If so, here is your required scanner, Kindly review –
https://chartink.com/screener/difference-between-vwap-and-ema50
Thanks Sourabh for the help. Could you please tell me how to set timeframe parameter in EMA
Hello,
When we click on the result stocks can it open with the screened timeframe and logic parameters applied within the chart.
For example: here our 2 parameters are vwap and EMA50. so when we open the chart can we have vwap and EMA 50 pre-applied on the chart itself along with the timeframe which was predefined in the screener.
Hello,
Thank you for reaching out. Click on the “Latest” timeframe. You can choose the timeframe from the dropdown list after clicking on it.
I hope this helps.
no actually
Hello Pinto, Currently, we do not have this feature. However, we may plan on adding it in the near term & l shall keep you posted on this.
need a scanner which gives difference which is greater than 2% from previous 5 min close to current close.
like: [-1] 5min close – [o] 5min close is greater than 2%
Hello,
Here is your scan for the same, kindly review:
https://chartink.com/screener/difference-between-current-and-previous-close-greater-than-2
Hi Support Team. After the demerger of Motherson Sumi, the screener is giving wrong results for the stock. Please rectify this issue ASAP.
Hello,
Thanks for reminding us. Our team is aware of this, and we’ll have this fixed shortly.
how to recall already created scan
Hello,
Your query is not clear. Could you please elaborate more on the same?
I don’t want any stock in scanner after 10:00 AM in 1 min time frame ?
Hello,
Here is an example scan running up to 10am. Kindly review:
https://chartink.com/screener/scan-stops-to-run-after-10am
Thank you so much, it’s really helpful for me.
I have 1 more question = let suppose i want 1 or 2 stock only in day, then what to do ?
HI
if i want to check RSI crossed from 50,60,70,90 for 5 minutes candle
then i have create like this
[0] 5 minute rsi crossed above number 50
[0] 5 minute rsi crossed above number 60
[0] 5 minute rsi crossed above number 70
[0] 5 minute rsi crossed above number 80
How can i do that in sigle statement
like
[0] 5 minute rsi crosed above between(50 to 90)
Thanks
Rakesh jain
Hello,
Please note we’ve already replied to your email query. I hope you have received your email.
I am getting an error running a scanner from a python script.
“Scan error – There was an error running the script”.
I even made it public from private.
Please help
Thanks
Madhu Mattangi
Hello,
We have created a ticket for this and reached out to your email to discuss this further.
Hello sir good morning.
Sir, my question is how to make a scanner in which a candle is crossed and closed above OR below all EMA (10,20,30,40,50) at once ???
Whatever the timeframe is.
Pls guide to make this scanner. Thank you
Hello,
We have reached out over email to you with regards to this query. Sharing the scan here for your reference:
Crossed above: https://chartink.com/screener/latest-close-crossing-above-all-ema-s-10-20-30-40-50
Crossed below: https://chartink.com/screener/latest-close-crossing-below-all-ema-s-10-20-30-40-50
Dear Sir,
I need to get the list of stocks that satisfy the criteria that EMA 20 is almost equal to EMA 50
in all segments and in both Daily and Hourly time frames.
Please Reply
Thank You
Hello,
Here are our scans in daily and hourly timeframe, kindly review:
https://chartink.com/screener/ema-20-nearly-equals-to-the-ema50-in-daily-timeframe
https://chartink.com/screener/ema-20-nearly-equals-to-the-ema50-in-hourly-timeframe
This is very useful article.
Thank you very much Sir.
Please include timeframe for pivot points. Even the latest(daily) is not giving correct results.
Hello,
Could you please share an instance where you have observed the results are not correct? Please share the details like scan URL, and sample chart images to [email protected], and we will look into the same and assist you accordingly.
I have a scan BTST 15 Minutes. If I run it now, it’ll give stocks of current time. If I run it after 15 Minutes, it’ll give the stocks at that time.
Now, I need to have ONLY common stocks that passed both, now and before 15 minutes.
Im trying to create this scan, but not able to do it. Maybe Im missing something.
Can someone help ?
Hello,
Please share the URL/link of the scan you refer to so we can review and respond. You can email the same to us here: [email protected]
HI
I have added widget on dashboard but the results are not ok.
i am trying to get socks which are less than 1 % but not showing all the results and have compared results with tradingview.
https://chartink.com/dashboard/122898?source=social-icons
Please solve this as soon as possibl
please provide voice support to atleast premium customers who has taken premium service.
and 1 more thing i am not able to change my emailid in my profile.
Thanks
Rakesh Jain
Dear sir,
please share me percentage on 50 SME price and current price.
I.e.100 Rs is current price and 2% is 2 Rs and need diff between current and SME with % and amount.
Thankyou,
Krishna sahu
Hello,
Here is your dashboard; kindly review it-
https://chartink.com/dashboard/128311
Hi,
Can we configure a scan where latest high and low are equal to the opening range 5 minutes bar high and low while the signal bar i.e. latest 5 minutes bar crosses above or below the opening range high and low bar? I can get both the parts of this scan individually to work but not together. Can you help please?
Regards,
Ankush
Hello,
Here are your scans; kindly review them-
https://chartink.com/screener/5-minutes-bar-crosses-above-opening-range-high
https://chartink.com/screener/5-minutes-bar-crosses-blow-opening-range-low
I am not sure but i think BSE indices are not available for scanning purpose. Only NSE indices are available. If you ould made BSE indices available that would be great.
Thanks
Hello,
We currently support only NSE cash stocks and indices; we plan to add other stocks and indices shortly.
hearing this from long time
at least futures should be added.
GOOD MORNING AND HAPPY VINAYAKA CHAVITI TO ALL TEAM SIR, Please help me to create a SCANNER for, “HIDDEN DIVERGENCE ” using “MACD ” INDICATOR in DAILY TIME FRAME. THANK YOU.
Sir,
I goes through this website and find that it’s better for knowledge Inhancement,,
Sir, I want to made a setup so that found some stock,,
Data-1– stock move to its 5℅ in 15 min,
2- after 5-6 days continues fall form a hammer
Thank chartlink,,
Regards.
Ye do scanner hai,,,
Scanner 1
And scanner 2
Hello,
Sorry, but we cannot get what you are trying to achieve here. Could you please elaborate more on your query?
Hello,
Sorry, but it is unclear. Could you please share sample chart images for both queries? So that we can review the same and try to create it accordingly.
Hi,
Loving the Platform, Haven’t used it to its full potential, lot to explore yet.
I am using a simple technique of EMA Crossovers.
I make High and Low EMAs of 48 Periods in any timeframe on tradingview
and also make a 5-period ema of the same timeframe ( I call them Green Red and Purple)
I can very much screen the stocks that have their purple crossing over green or red.
But I am not able to think of a formula that finds the stocks that are just about to break that EMA barrier (let’s say on a daily chart, EOD calculation)
something like Purple (5 EMA) is just below Green (48 EMA High) and about to cross maybe tomorrow
Hello,
Sorry, but it is unclear. Could you please share a sample chart image for the same? So that we can review the same and try to create it accordingly.
Is there a way to get delivery volume as against the overall trade volume for a stock. Something similar to what you see at https://zuarimoney.com/bse-nse-highest-and-lowest-delivery
Hello,
Currently, we do not have a delivery feature. However, we may plan on adding it in the near term & l shall keep you posted on this.
GOOD EVENING SIR,
PLEASE HELP ME TO CREATE A SCANNER FOR ” MACD LINE CROSSED ABOVE MACD SIGNAL LINE ” AND THIS CROSSOVER HAPPEND AT ANY OF THESE BELOW CONDITION :-
CROSSED ABOVE’ MACD ZERO’ LINE , +0.001 , +1 , +2 , +3 . I TRY TO MAKE IT , BUT RESULTS ARE BAD . PLEASE HEP ME
Hello,
Sorry but your query is not very clear. Do you mean the crossover should happen above the zero line? Please clarify what you mean by “+0.001 , +1 , +2 , +3”. Can you please share a sample chart image for the same? Also, please share a sample chart image for MACD divergence so we can help create the scan for you. You can email us the details here – [email protected]
Good morning sir, yes, my meaning is that ” CROSSOVER ” should happen above zero line, but not far away from zero line, it must be happen very closer to the zero line, please help me to create this scanner as early as possible . i am trying to do this but results not good , i miss something sir , pls help me, Thankyou.
Hello,
Here is a scan for the same. Kindly review:
https://chartink.com/screener/macd-crossover-above-0-line-but-within-3-daily-timeframe
This checks for the crossover to be above the zero line but within 3. I hope this helps.
Thank you very much Sir.
YES SIR IT SHOULD CROSSED ABOVE ZERO LINE WITH ALL ABOVE MENTIONED PARAMETERS MET PLEASE HELP ME . JUST NOW I SENT A PICTURE OF’ MACD ‘ PICTUE FILE ALONG WITH AN EMAIL TO OUR SUPPORT TEAM. THANK YOU.
GOOD EVENING SIR,
PLEASE HELP ME TO CREATE A SCANNER FOR ” MACD ” – HIDDEN DIVERGENCE ” FOR BULLISH . THANKYOU.
Hi Chartlink
1. is there a predefined parameter that allows BETWEEN operation ?
example : to filter stocks in a range say from Rs 250 to Rs 700
2. What is the method to filter n candles in t time frame where the change is less than say .2%
example to filter past 10 candles of 5 minute time frame where change is less than 0.2%
Thanks
AM
Hello,
Here are your required scans; kindly review them-
1. https://chartink.com/screener/stocks-in-a-range-say-from-rs-250-to-rs-700
2. https://chartink.com/screener/past-10-candles-of-5-minute-time-frame-where-change-is-less-than-0-2
how to get stock filter which has weekly candle supertend (7,3) crossbelow open candle or with suppertrend (20,2.2) crossbelow weeekly open candle, both condition in single scan and any one of condition satisfy result should display
Hello,
Here is your scan; kindly review it-
https://chartink.com/screener/super-tend-7-3-or-20-2-2-cross-below-weekly-open-candle
i paid 780 1 month sub
Hello,
How can we help you here? Please feel free to let us know.
Hi Team,
I need a scanner for pivot point, Means the current 15 minutes candels closes above and below H1 and crosses above and below S1.
Hello,
Do you mean the current 15-minute close crosses above or below the pivot R1/S1? If so, here are your scans, kindly review them:
– https://chartink.com/screener/current-15-minute-close-crossing-above-or-below-pivot-r1
– https://chartink.com/screener/current-15-minute-close-crossing-above-or-below-pivot-s1
Issue with MAX function
Currently MAX function does not show Stocks where there is no value/record
Example- LICI listed 17 weeks back
and if run the MAX function like:
1 Week Ago MAX(25, Weekly close) >= 800 – it DOES NOT show LICI
but if I run it like
1 Week Ago MAX(17, Weekly close) >= 800 – it DOES show LICI
So system is ignoring the stocks where there is no value/record found, Ideally reference should be on the available value – whatever is there against the stock
Hello,
This is not a bug but how the max function currently behaves. To show results of a maximum condition requires those many candles to be present.
You can include a custom logic to show those stocks where those many weeks are not present. Here is an example scan showing those stocks where 11-20 weeks of data is not present.
https://chartink.com/screener/max-weekly-close-if-11-20-weeks-data-not-present
Hi Aaron,
this was just an example as LICI, where you put in the same code 10 times considering 10 weeks in hand from 10th to 20th week – With Stock passing ANY of those above 10 logic
Now consider the 2 year time frame where there are 104 weeks and you don’t know which stock is listed at what point in time
and you want to filter out stock in last 2 years which are listed in range of 800-900 at a weekly basis
what should be the way out
@chartink team,
Please update, thanks
Dear Chartink,
Is it possible to scan the stocks with an island reversal pattern on Daily chart?
Hello,
Sure, please do share with us a sample chart image of the same for our reference, and we would be happy to help create a scan for you accordingly. You can email us the sample chart image here – [email protected]
Good morning Sir,
i am trying to set a scanner for
PRICE MADE HIGHER LOW at the same time RSI MADE LOWER LOWER LOW on DAILY TIME FRAME
But result out put not good , please help me to create a SCANNER on above CONDITIONS,
THANKYOU.
There is a screener below
https://chartink.com/screener/avv-range-break-out-with-volume
But the back test results is not giving the time , it only gives the date . If there any way we can get Date + Time in back test results ?
Hello,
The backtest depends on the timeframes used within the scan. The scan you’ve shared uses only the daily timeframe; hence, the backtest results show the daily bars in the backtest. You can try using intraday timeframes in order to see backtest results of those particular bars.
How to set the screener to send alerts only for new results after 9:30 only
Below is the sample screener
https://chartink.com/screener/copy-nr7-break-out-strategy-with-volume-14
Hello,
You can add a condition “[=2] 15 minute Close > 0 ” to ensure the scan will show results only after 9:30 AM. I have modified your scan by adding this condition. Kindly review:
https://chartink.com/screener/range-break-out-with-volume-v2-3
hey, how to do settings for nr7 narrow range from chartink ?
Hello,
Here is your scan; kindly review it:
https://chartink.com/screener/nr7-breakout-daily-timeframe
Sir,
Can you help with this condition for a scan ? How to find those stocks whose current day volume is greater than the previous 10 DOWN days volume (not just the last 10 days but the last 10 down days only). I am struggling with the IF conditions.
Hello,
Here is a scan for the same; kindly review:
https://chartink.com/screener/current-volume-is-greater-than-the-maximum-of-10-days-down-volume
Thank you Sir !
Hi Team,
I just want to check if it is possible to know last 50 max volume candle high and low values? For e.g. on 18 oct 5 min candle has max volume. Is there any way to find the max volume candle high and low values and filter stocks if current close crosses its high?
Appreciate your support
Hello,
We hope you received our reply. We did receive your email with the same request and have responded to the same. If not, I am sharing the reply here for your reference:
This can be done with the Atlas dashboards. Here is a dashboard for the same:
https://chartink.com/dashboard/138587
Requested sir,
i want only new high/low of 10:00 am high/low?(break 10:00 am high/low in 5 min chart)
hope you understand,
thanks…
Hello,
Sorry but your query is not very clear. Can you please elaborate a bit more on what you mean by “new high/low of 10 AM”? Are you referring to the maximum high/ minimum low that was created until 10 AM? Please share a sample chart image of your requirement highlighting the same so it would help understand the same. You can directly share the details via – [email protected]
Hello Please add Rate of change (ROC) indicator with Length change feature for alert segment
Hello,
Currently, we do not have this indicator in our default indicator list. However, we may plan to add it in the near term. Further, you may create a custom indicator for the same; here is your sample scan for your reference; kindly review it-
https://chartink.com/screener/10-21-45-roc-all-above-zero
You may review the logic behind the custom indicator by clicking on the purple sign next to the indicator.
Hi , how to get the column of 20EMA for the list of some selected stocks?
Hello,
It is currently impossible to add/edit columns in the scan. You can add/edit the column in the Atlas Dashboard. Here is an example dashboard view; kindly review it: https://chartink.com/dashboard/142590
Create 4 scanner using the following criteria:
1st scanner:
Consolidation : minimum consolidation of 4 months (sideway, Multiple time tested Support and resistance areas)
Consolidation Breakout with volume & kind of marubozu candle on daily time frame.
2nd scanner:
Downtrendline: Downtrendline that has been repeatedly tested, at least three times in the last minimum of four months.
downtrendline Breakout with volume & kind of marubozu candle on daily time frame.
3rd scanner:
retest of the support that was resistance before it was broken on the first scanner.
4th scanner:
retest of the Downtrednline which was broken on the 2nd scanner.
Hello Afnan,
Below are your required scanners; kindly review them –
1 ] https://chartink.com/screener/consolidation-breakout-with-volume-of-marubozu-candle
2] https://chartink.com/screener/downtrendline-that-has-been-repeatedly-tested-marubozu
For scanner numbers 3 and 4, Could you please share example images for our reference so we can create your scan accordingly? Please share your requirements here – [email protected]
Hi Chartink
Can you kindly help in defining a scanner
the conditions are:
1. timeframe – 5 minutes
2. over the past 10 candles, value of ALL the 10-20-50 and 100 EMA are within a band on 0.1%
3. across ALL the past 10 candles the value of EMA 10 > 20 > 50 > 100
Thanks a Ton !
Regards
Hello,
Here is our scan; kindly review it:
https://chartink.com/screener/all-the-10-20-50-and-100-ema-are-within-a-band-on-0-1-ema-10-20-50-100
Hi
Can you help me in creating the query for sorting the stocks in which the first two 5 mins candles are green with no wicks ?
Regards
Anju
Hello,
Sure, here is your scan; kindly review it: https://chartink.com/screener/the-first-two-5-mins-candles-are-green-with-no-wicks
Thank you Sir for your help. But all the stocks shown in the list , the first two 5min candles are not fully green.
Hello Anju,
I reviewed your scan results, and it matches the scan condition(5-minute days, first 2 candles green). Could you please share example stocks where you noticed results are not matching? You can reach out here for more clarification – [email protected]
hello
1) will you plz make the scanner for monthly and weekly breakouts (Multiyear Breakouts after long consolidation) this is important condition, I have tried lots of inputs but results are not as desired, we will do rest of the modification like volume, indicator ,and closing price,
thanx
hello ,
why your sent scanner is not showing in, kindly upgrade that link as no stock is come under when i search, so request you to kindly resend with little modification,
simply i need weekly and monthly breakout stock for positional trading
thanks a lot
Hello,
Below is an example scan for your reference, Kindly review it –
https://chartink.com/screener/current-week-crossing-above-to-2-year-high-104-weeks-with-volume
In the above scan, I have taken a period of 2 years, and the current week’s volume should be above the preivous 20-week average volume; I hope this helps.
hello chart ink,
request you to create scanner with following crieria
all moving Averages (SMA) like(20,50,100 and 200 SMA) will be crossed each other or overlap each other at any time frame like 1hr to monthly.
thank you
Hello,
Here is an example scan for 1hour timeframe; kindly review it:
https://chartink.com/screener/sma-like-20-50-100-and-200-sma-will-be-crossed-each-other-in-1hour-timeframe
You can elect the timeframe from the dropdown list and modify the scan as needed.
Hi Team,
Please help me with a scanner for stocks that crosses above Pivot R1 resistance for the first time in a day (5 min)
Hello Roman,
Here is your required scanner, Kindly review – https://chartink.com/screener/stocks-that-crosses-above-pivot-r1-resistance-for-the-first-time-in-a-day-5-min
Hello, I need some help for one chart, if you can help to get this prepared on chartink.
Swing HIGH low Support and Resistance
+ RSI 60/40 with 14 close SMA 14 2
price crossed up/down @15 minutes and daily chart only.
Hello Singh,
Could you please share a few examples of charts with us so we can create a scan based on them? Contact us at “[email protected]”.
Dear sir ,
will you please creates following types of scanner for me
1.)Multi year Breakout After down trend or long consolidation either on weekly or monthly time frame.
2.)bullish inverted hammer or hammer candlestick on daily or weekly chart after long or short down trend
one more thing i want to know that in your previous reply (scanner)u have mentioned hourly time frame as Number 1.01 , so what should have to put in the scanner for daily ,weekly and monthly time frame.
thanks a lot
Hello Fahan,
Below are some examples of scans, Kindly review them –
1] https://chartink.com/screener/multi-breakout-after-downtrend-on-weekly
2] https://chartink.com/screener/bearish-hammer-on-daily
3] https://chartink.com/screener/bullish-hammer-on-weekly
4] https://chartink.com/screener/inverted-hammer-on-weekly-candles
6] https://chartink.com/screener/inverted-hammer-on-daily-candles
Modified scans are below –
7] https://chartink.com/screener/sma-like-20-50-100-and-200-sma-will-be-crossed-each-other-in-daily
8] https://chartink.com/screener/sma-like-20-50-100-and-200-sma-will-be-crossed-each-other-in-weekly
9] https://chartink.com/screener/sma-like-20-50-100-and-200-sma-will-be-crossed-each-other-in-monthly
hi sir,
can you please help in creating scanner with avwap indicator
Hello,
Currently, we do not have an Anchor VWAP Indicator. However, we may add it in the near term & l shall keep you posted on this.
Dear,
Thank you for providing us a good scanner system. Please note that the above tutorial “Oversold filter: RSI crossed above 30 image is incorrect. It shows 70.”
I am requesting for some filter/option/update to add on chartink scanner option. ie.
1. There is no option for store a value in a variable, that how many times a condition satisfied or on which no of candle it satisfy the condition. There is a only a number output. I need to use the output value in same script with other condition. Like output value ‘n’ used for ‘n+5’ th candle with other condition or price condition with ‘n’ and math function.
Atlest 3 variable per script, which is valid for the script only.
2. Please add Trigonometric functions like Sin, cos,tan with angle (If possible).
3. In custom indicator section it is only one line script, no condition function allowed. Please allow condition test with more than one line.
4. In chart sometimes price provided are not same with NSE price.
5. In chart view the price shows with volume for each candle when a candle sclect, but in below chart indicator value not shows with respect to candle. It shows last candle value.
Thanking you.
With worm regards.
Hello,
Thank you for bringing this issue to our attention. We have corrected it. Please review it.
1. In order to better understand the problem, we would appreciate additional details on this.
2. we do not currently have access to the requested math functions. However, we will bring this matter to the attention of our team and inform you of any updates or developments as they become available.
3. Could you please provide the formula for the custom indicator you are attempting to create? This will allow us to review and respond to your request more accurately
4. To prioritize resolving this issue, could you please provide a list of the specific stocks where you have noticed it?
5. Currently, we do not have the requested feature available; we are in the process of updating our charts and have included this feature in our next release. We appreciate your patience and understanding as we work to improve our platform
If you require any assistance or have further questions, please contact us at here – [email protected]
Dear Chartink Team,
Do we have any condition where i Can set the name/code of the stock and check that how many times that stock has come in my chartink scanner.
Thank You,
Nitesh
How do I make screener for days last 10 minutes candle (single)
I mean I want to search for a bullish or bearish candle which is formed in today’s last 10minutes
Hello,
If you want to scan only specific candles, then you can achieve this by adjusting the offsets; here is your example scan; kindly review it-
https://chartink.com/screener/days-last-10-minutes-candle-either-bullish-or-bearish-candle
Got it
Thanx a lot
Hello,
Thank you for the update.
Can anyone plz help
hi i need few scan option
1)i put moving year average indictor.
2) 5% upper circuit scanner.
3) How can i track stock last 4 days upper circuit + volume.
hi i need few scan option
1)i put moving year average indictor.
2) 5% upper circuit scanner.
3) How can i track stock last 4 days upper circuit + volume.
Hello,
Sorry but your query is not very clear. Can you please elaborate a bit more on what you are trying to achieve here exactly? Please share more details on this and a few sample chart images for our reference. We’d be happy to help create a scan for you accordingly.
I found that in a comment earlier , you said that US Markets will be available to scan soon (by the end of 2021) . Is it available now ? Please guide.
Hello,
This is not yet available. We will surely keep you posted as and when this is available. Thank you for your patience.
Hi,
I’m looking for a scanner which shows 8ema crossing 20 ema from below ( create uptrend) and value of stock is between 100 INR and 500 INR.
kindly help
Hi,
I’m looking for a scanner which shows 8ema crossing 20 ema from below ( create uptrend) and value of stock is between 100 INR and 500 INR.
kindly help
Hello,
Here is your scan for the same. Kindly review:
https://chartink.com/screener/ema-8-crossing-above-ema-20-daily-timeframe
Thanks a lot. can this be applied to all time frames. if not, kindly provide one for 5 min time frames.
Thanks in advance
Hello,
This is only for the daily timeframe. Here is a scan for the same in a 5-minute timeframe:
https://chartink.com/screener/ema-8-crossing-above-ema-20-5-minute-timeframe
Thanks a lot
Hi,
I have a scan like this,
Latest Close greater than 10 days ago close.
The scan gives a result of stocks sorted with the latest change in descending order.
My question is, how can I sort the results with respect to the above condition? Like, in the result, the first stock should be the most moved stock past 10 days.
Is this possible?
I use Atlas and in group/filter there’s only sort column by change, volume, sector, industry is only available. Please help
Thanks in advance.
Hello,
Sure, this is possible in the atlas dashboard currently where we can create a column for the 10 day % change and sort the results as per that column. Here is an example dashboard for your reference:
https://chartink.com/dashboard/153125
Hi,
Thanks a lot. Very much pleased of your help.
hello,
will you please create a multiyear consolidation scanner on monthly and weekly Time frame.
Hello,
Sorry, but your query is not very clear. Could you please elaborate more on the same and, if possible, share a sample chart image for reference?
hi,
Actually I need a scanner which display the stocks which are consolidating in a range for last 3-5years or more than this time duration, breakout or breakdown is not mandatory if show than no problem ..hope u got my query.
Hello,
Please share a sample chart image for our reference so we can help create the scan accordingly. You can share the details directly via email to “[email protected]”.
Please help create a scanner for:
AVERAGE NET PROFIT for last 10 years is greater than 15%
Hello,
We would currently only be able to do this for a period of 5 years since the data is not present. Here is your scan for the same. Kindly review:
https://chartink.com/screener/average-net-profit-for-5-years-greater-than-15
Hi,
I’m looking for (2 no’s) 5 min time frame scanners .
1. 5 ema, 13 ema and 26 ema crossing each other at one single point to create uptrend and value of stock
should be between 75 INR and 500 INR.
2. 5 ema crossing 13 ema from above to create downtrend and value of stock should between 100 INR and
500 INR.
kindly help
Hello,
1. Could you please share a sample chart image for 5 ema, 13 ema and 26 ema crossing each other at one point? So based on that, we will try to create it accordingly.
2. Here is your scan for the 5 ema crossing 13 ema from above to create a downtrend, and the value of the stock should be between 100 INR and 500 INR; kindly review it-https://chartink.com/screener/5-ema-crossing-13-ema-from-above-to-create-downtrend
Thanks a lot.
https://kite.zerodha.com/chart/ext/ciq/NSE/PENIND/5278977
PENIND
You can see the crossing between 9.02.23, 3.25pm and 10.02.23 9.15 am.
hello,
could you please you create an scanner for me , which shows stocks in demand zone or near to demand zone specifically on Daily TF, and also request you to show how to create same scanner on different time frame..
thankyou,
Hello,
Could you please elaborate more on what you mean by demand zone?
I mean to say RBR or DBR pattern formation on any TF.
RBR: Rally Base Rally
DBR: Drop Base Rally
in other words you can say unfilled order candles formation.
hope got my point.
eagerly waiting for generous reply.
Hello,
You can search for Rally base Rally or Drop base Rally scans here:
RBR – https://chartink.com/screeners/search?search_term=rally+base+rally
DBR – https://chartink.com/screeners/search?search_term=Drop+base+Rally
If you have specific criteria for filtering out such stocks, please share the details and a few sample chart images for our reference. You can directly share the details via email with us @ [email protected]
Hello Team,
I want to calculate relative strength of volume for 14 days .. how this is possible with chartink ?
Trading view pine script gives us a simple function to pass anything other than “close” i want something similar to that.
Keep up the good work ..
Thanks
Hello,
Sorry, currently we do not have a feature to change the source of the RSI, as the default source is close.
Hi, Can you help me with pivot point R4/S4 which is not available in the indicator list and how to implement.
Hello,
Sure, you can create this with the help of a custom indicator. Here is an example scan for the same:
https://chartink.com/screener/close-either-above-r4-or-below-s4-daily-timeframe
You can view the logic/formula for the custom indicator by clicking on the purple sign next to the indicator. I hope this helps.
Hi, I am really grateful for your early response. Somehow i am unable to do add this pivot points in my scan configuration, unable to find pivot point R4/S4 which are in the list me custom indicator, but i am unable to find in my list.
Please help further.
Thank you.
Hello,
It is not possible to find it under your list of indicators since the custom indicators were created at our end and are only visible to the user that has created it.
Here is a video tutorial that you can use as a reference to create/copy a custom indicator at your end so it is visible under your list:
Copying a custom indicator: https://drive.google.com/file/d/1rifE_Bp6Jg8grdE-Fd_OPuW_ELdCkRZ0/view?usp=sharing
Creating a custom indicator: https://drive.google.com/file/d/1bnr1ahmajyXIpBRE69ese60sm7541-14/view?usp=sharing
my idea is first candle length should below 1.5 % movement of any stock only in future stock
next 2nd 3rd candle should inside the fiesrt candle ..never break first candle high or low ,4th candle break 1st candles high and low that i need …lot size of stock that should be editable bye me .i prefer lot size 400 to 700 only.
I want a scanner for forex currency.
Hello Vivek, We currently support only NSE cash stocks and indices; we plan to add Global stocks and indices too shortly.
hi
i am lokking forward to make screener for linear regression curve.
Regression Formula: y = a + bx
Where
Y is close price of a bar in the selected period
X is the Bar’s number
N is number of bars in the selected period
The slope and the intercept are calculated in the following way:
Slope (b) = (NΣXY – (ΣX)(ΣY)) / (NΣX2 – (ΣX)2)
Intercept (a) = (ΣY – b(ΣX)) / N
Hello,
Sorry, but we do not have the “linear regression”, so this would not be possible within the system.
can anybody help me with linear regression curve scanner
hyy plz help me to made scanner for me… stocks nifty 500 open near ( below or above) bb 20 sma and open pivot below and above ..
Hello,
Sorry but your query is not very clear. Can you please share a sample chart image for the same for our reference? You can share the same to – [email protected]
can i ask question in hindi caz my english is not good sir ….
hlo sir i need a scanner which is open near 20 sma of bolliger band (below or above 20 sma).stock should be in the list of future and option stocks…thanku youuu
Hello,
Here is your scan for the same. Kindly review:
https://chartink.com/screener/open-within-1-of-sma-20-of-bollinger-band-daily-timeframe
Here, I have considered the Open and the SMA 20 to be within 1% of each other.
sir stock must be from only fno stocks …plzz modified setup ..
Hello,
I have modified the same. Kindly review:
https://chartink.com/screener/open-within-1-of-sma-20-of-bollinger-band-daily-timeframe
have a scaneer that can work in live market for intraday trading
I had raised a query but it is not visible in above section???
Hello,
I believe you are referring to this query:
I want to create a string for volume , criteria will be like “current” 5 min candle volume greater than “previous” 5 min candle volume .
and one more string for same but one more 5 min candle volume
If so here is our reply to the same:
Hello,
Do you mean you want to scan for stocks where the volume is increasing in the last 2 candles on a 5 minute timeframe?
If so, here is your scan for the same. Kindly review:
https://chartink.com/screener/volume-increasing-for-2-candles-5-minute-timeframe
hi sir
i need custom indicater
Least ( Current Candle Open , Current Candle Close
Hello,
Sure, here is your custom indicator for the same:
https://chartink.com/indicator/least-of-open-close
Hello Chartink Team!
Loved all the features that you have provided for creating a good scanner. However, want to understand if you can help us provide a feature where we can assign a variable as well. For example, if one can assign “x” as high of a current candle (any timeframe – 5min, 15min, 1 hr etc) and “y” as low of the current candle and see if price opens higher or lower than “x” or “y” in future (say next day) and we get an alert?
Please help.
Thank you.
Hello,
Thank you for your kind feedback. We are happy to help you.
Sorry, but it is not very clear. Can you please elaborate or share a use case of what you are trying to achieve here exactly?
Hello Chartink Team!
Thank you for your reply.
Here is the link to my scanner – https://chartink.com/screener/test-2022-12-09-27
It gave “Dhani” as one result at 3:25 PM on April 3rd and “RTNIndia” at 9:30 AM on April 5th (today). I want to assign high of these marked candles (3:25 PM and 9:30 AM) to a variable, say “x”. This “x” should store value of candle’s high and whenever price goes above “x” then I get an alert. Similarly, I want to assign candle’s low to “y” and get an alert whenever price goes below “low” of the marked candle.
Hope I could clear things now.
Thank you.
Hello,
Sure, we can try achieving this by using the count within the max high function. Here is a scan that shows the current close is crossing the high of the “x” candle where the logic for the “x” candle is taken from this scan – https://chartink.com/screener/test-2022-12-09-27
Scan URL: https://chartink.com/screener/close-crossing-above-high-of-the-x-candle-5-minute-timeframe
Dear Chartink Team!
Thank you so much for your help! Code seems difficult to understand and a bit daunting. Is it possible to share a guide about how one can use the max high function? I will try to learn and make changes as per my other requirements.
Thank you very much once again.
Hello,
We can use the count within the max function by adding the max and checking the maximum value within a certain period, like 5 or 10 candles. Inside the max function we specify the attribute we want (for example high of the candle) so we would specify the same as below:
Max (10, high….
After this, we multiply this with a count function which would fetch the condition that we are looking for. For example, we want the high of the candle where the RSI crosses above 70. We would fetch the same as below:
Max (10, high * count(1, latest RSI crossed above 70).
This would fetch the High of the candle where the RSI crossed above 70. I hope this helps.
required scan open = low and above previous day high rsi above 40
same open=low nd trade below previous day low rsi below 40
Hello,
Here are your scans for the same. Kindly review:
– https://chartink.com/screener/open-low-previous-day-rsi-40
– https://chartink.com/screener/open-low-previous-day-rsi-40-2
req scanner open=low nd trde above previous day high
Hello,
Here is your scan for the same. Kindly review:
https://chartink.com/screener/open-low-trade-above-previous-day-high
req scanner open = low and above prvious day high
Hello,
Here is your scan for the same. Kindly review:
https://chartink.com/screener/open-low-trade-above-previous-day-high
Hello Chartink Team!
Request help for a scanner
condition 1. high of the first 15-minute candle of the current day is less than the high price of the first 15-minute candle of the previous day
condition 2. low of the first 15-minute candle of the current day is greater than the low price of the first 15-minute candle of the previous day
Thanks
A Mx
–
[=1] 15 minute High [=-25] 15 minute Low
Hello,
Sorry but your query is not very clear. Can you please elaborate a bit more on your requirement?
can you elaborate why -25 and not -24 … there are 24 (15 min) candle in a trading day
thanks
A Mx
Hello,
There is a total of 25 candles for 15 minutes a day. You can verify it here – https://chartink.com/stocks/nifty.html
You can select the chart period “1 day”; the range should be “15 minutes”.
Hello,
Here is your scan for the same. Kindly review:
https://chartink.com/screener/1st-15-minute-high-1st-15-min-high-of-yesterday-similarly-low-low-of-yesterday
Hi Chartink Team
Can you make a scanner for the following conditions:
On Daily Timeframe
In any of last (10-50) days, Stock opens above upper BB and
latest low is lower than latest lower BB.
Another scanner for the following conditions
On weekly Timeframe
In any of last (8-20) weeks, Stock opens above weekly upper BB and
latest weekly low is lower than latest weekly lower BB.
Thanks in adavnce
Hello,
Here are your scans for the same. Kindly review:
– https://chartink.com/screener/opening-above-upper-bb-in-the-last-10-50-days-current-low-lower-bb
– https://chartink.com/screener/opening-above-upper-bb-in-the-last-8-20-weeks-current-low-lower-bb
Hi
Thanks for the efforts u put out for me….
Daily BB scanner given above is working superbly but
Weekly BB scanner is not showing correct results… Eg Bharat Forge has not opened above Weekly upper BB in any of last 20 weekly candles….. please check and do the necessary modifications if any.
Thnaks in advance
Hello,
I have modified the scan for the open to be greater than the upper Bollinger band in any 1 of the last 20 weeks. Kindly review:
https://chartink.com/screener/opening-above-upper-bb-in-the-last-8-20-weeks-current-low-lower-bb
Hi Team,
I want to apply a simple formula as below:
low <= close – (open-close)*2
i.e. Note that this formula will scan for stocks where the low price of the day is less than or equal to two times the difference between the open and close prices of the day, subtracted from the closing price.
Can someone please guide me how to write this formula in chartink, as I am getting weird results
Best,
Piyush Jain
Hello,
Here we have tried to create a scan for you as per your requirement. Please review it:
https://chartink.com/screener/low-close-open-close-2
i want to make a customised query. and when happens it gives alert.
condition is this.
in daily
on 90th day high price is made,
on 91st and 92nd day high price is not traded
IN DAILY
on 90th day LOW price is made,
on 91st and 92nd day LOW price is not traded
Hello,
Can you please clarify what you mean by the below:
“on 91st and 92nd day high/low price is not traded”
Do you mean the below:
– 90 days ago high should be the highest in the last 90 days from today.
– 89 days ago & 88 days ago the high should not have been broken?
How to get the ascending triangle breakout in futures like you have shown in book
Hello,
Sorry, but it is not clear as to which book you are referring here. Here is an example scan for an ascending triangle breakout for your reference:
https://chartink.com/screener/ascending-triangle-breakout-pattern-daily-timeframe
signal comes late.
Hello,
Could you please share more details on the same so we can review and respond?
Please share the below details:
– Which alerts are you referring to? Email, SMS or web notifications?
– Kindly share the URL/link to the scan that you refer to.
– Share a few example stocks from the results of this scan where you should have received and alert sooner but, you got it with some delay.
– Share a screenshot of your alert settings for this scan. You can do so by opening the scan and clicking on the “modify alert” option and sharing a screenshot of the alert settings here for our reference.
You can share the details directly to – [email protected]
plz revert my query on mail
Hello,
We have unfortunately not received any email communication from your end. Could you please share the same again for our reference?
Hello,
Can you please help me to create the below scan:
1) Candlestick close above upward sloping moving average – Candlestick should be touching the MA.
2) Candlestick close below downward sloping moving average – Candlestick should be touching the MA.
Hello,
Please share a few sample charts highlighting the same for our reference so we can help create the scans for you accordingly.
You could share the images directly to – [email protected]
Done sir
How can i create a relative strength scan against Nifty for a particular stock?
Hello,
Please note that currently, we do not have a Relative Strength feature and we are in the process of exploring the possibility of adding this feature & new indicators soon. We appreciate your patience as we improve and enhance our service for our users.
An offset is automatically added before a stock attribute. When I choose SMA as the stock attribute, another offset gets automatically added within the parenthesis of the SMA function. What is the difference between these two offsets?
Please note that you need to enter “offset” either outside or inside the bracket. Otherwise, it will get added.
For example-
1 day ago Sma ( Latest Close, 20 ) and Latest Sma ( 1 day ago Close, 20 ) both are 1 day ago sma20
and
1 day ago Sma ( 1 day ago Close, 20 ) it is (1+1) 2 days ago sma20
I hope this is clear.
Clear. Thank you for the quick response.
There may be technical reasons for having it this way. My personal view is that this is a potential source of confusion when there is an offset both inside and outside of the parenthesis doing the same function and the feasibility of getting this redundancy removed may be looked at.
Hello,
Thank you for your honest feedback. We will surely share the same with our team.
Hello,
please help how to create a scanner for the stock …….which has Break out/ or Break down of IB (Initial Balance) for 1 hour on the previous day.
Hello,
Sorry, but your query is not very clear. Could you please elaborate more on “Initial Balance” or share chart or any screenshot fo reference to create a scan for you.
hi,
I am not able to paste a screenshot of my scanner here. 1st one-hour rage is the Initial balance for me.
my query is I need to scan stocks for intraday trading whose high on the previous day is greater than the first 1 hour’s high of the same day.
I have made a scanner as follows
1 day ago high Greater than [=-5] 1 hour high
is it correct?
regards
sunil
Hello,
The offset [=-5] is incorrect. We need to user the offset [=-7] to access the 1st 1 hour candle of the previous day. Here is the correct scan for the same:
https://chartink.com/screener/high-on-the-previous-day-is-greater-than-the-first-1-hour-s-high-of-the-same-day
thank you very much sir.
Although subscribed, created scan of 5/12 ema buy but not getting alerts (SMS or Browser Notifications or Email).
backtest showing the result but alerts not generated, then what’s use. I can monitor result on trading platform, its pathic. only subscription days will expire.
Hello,
We received your email stating the same and have reverted back with a response. I hope you received our response and were able to make the changes we suggested.
Hi, I want to create a filter having condition
(EMA 200 Less EMA 100) Divided by EMA 200
between -0.01 to +0.01
How to use between option
This filter is to identify the Squeeze between EMA 200 and EMA 100
Hello,
Your query is not very clear. Could you please elaborate more on “(EMA 200 Less EMA 100) Divided by EMA 200 between -0.01 to +0.01” ?
If possible please share a sample chart image for reference to create a scan for you.
Hi,
Is it possible to create a scanner meeting following criteria.
15 min candle closes below open ( forms red candle) but stays above 10ema @ 3.15 pm and the next green candle closes above the red candle @ 3.30pm
Price INR 100 to INR 500
Thanks in advance
Hello,
Here is your scan for the same. Kindly review:
https://chartink.com/screener/24th-15-minute-close-25th-15-minute-close-24th-red-25th-green-15-minute-time-frame
I WANT A COMPANY WHICH IS MAKING 52 WEEK HIGH FROM NSE 500 AND BSE 500 HOW CAN I ADD THIS BENCHMARK INDEX
Hello,
We currently support only NSE cash stocks and indices; we plan to add Global stocks and indices too shortly. Here is a scan showing 52-week high stocks on the Nifty 500 segment:
https://chartink.com/screener/close-52-week-high-daily-weekly-time-frame
https://chartink.com/screener/5-min-volume-for-day
why is this scanner not picking Dixon when run on 22nd May 2023. Dixon’s average of last 6 candle (5 min) * 5 is greater than today’s opening 5 min candle. Can you please advise.
Hello,
I do see the stock “DIXON” being shown in the backtest results for this scan on the 22nd May 2023. Are you not able to see this?
I made some changes to the filter, earlier i was using sma (volume, 6) after that i used sma([=-1] volume,6)…now i have fixed the issue. Instead of greater than i am using lesser than now, and shifted the todays todays 5 minute candle to right. Thanks for the reply.
Hi Aaron, pls ignore my earlier reply. I made some mistake while analyzing the data. Can you check this now.
https://chartink.com/screener/new-5-minute-4
Dixon’s volume EMA for 6 candles is around 12,572 for 21st May 2023 last 5 min candle as per Trading view. That multiplied by 5 come to around 62,860, which is less than opening 5 minute candle volume of 70,516. Can you please check why this is not working. Thanks.
Hello,
Thank you for your email. I reviewed this and noticed the offset used in the scan for the SMA seems incorrect. Here is the correct version for your reference:
https://chartink.com/screener/1st-5-min-volume-is-greater-than-5-times-the-sma-6-from-1-candle-ago
We have also noticed an issue with the stock DIXON for that particular day, causing this not to show in the results. We are looking into this and will keep you posted on this. However, you can notice the stock ADANIENT showing in the results on 22nd May for the above scan. I hope this helps.
Thanks a lot for the help with the scan. Do you have any pdf or training documents/sop or is it just the 3 videos (on YouTube) I have to refer in future. Looking forward for your reply on Dixon.
Also to answer your question. I do not see Dixon, also Adanient is not visible which had a large volume. Can you please check.
Hi sir,
Can i get scanner back test details with customized columns. i am unable to change columns in regular scanner page it is giving pop up message go to atlas dash board. In atlas dash board there is no back test option. Please check and reply
Hello,
Currently, it is not possible to do this. We understand your concern and appreciate you bringing this to our attention. Currently, we are in the process of exploring the possibility of adding this feature & new indicators soon. We appreciate your patience as we improve and enhance our service for our users.
Hi, I would like to know each and every “Math functions”out there, please provide me with some relevant links or study materials.
Hello,
Here is the explanation:
Absolute Value Functions. An absolute value function is a function that contains an algebraic expression within absolute value symbols. Recall that the absolute value of a number is its distance from 0 on the number line.
The CEIL() function returns the smallest integer value bigger than or equal to a number. Note: This function is equal to the CEILING() function.
The floor() function calculates the floor of a numeric value. The floor of a numeric value, say Value A, means the largest integer smaller than Value A if Value A is a floating-point number, or Value A itself if it is an integer.
If you need to round a number normally (i.e., round values of .5 or more up and values less than .5 down), you can use the ROUND function with a specified number of digits.
In mathematics, a square results from multiplying a number by itself. The verb “to square” is used to denote this operation. Squaring is the same as raising to the power 2 and is denoted by a superscript 2; for instance, the square of 3 may be written as 32, the number 9.
Using Bracket on something like “Bracket(1.5)” will result in the same value, 1.5, whereas using 1.5 against ceil, floor, a round will result in different values, like
Round(1.5) = 2
Ceil(1.5) = 2
Floor(1.5) = 1
If you need any help creating a scan, please share your scan requirements and a sample chart image so that we can try to create a scan for you.
hi, thank you for providing such a wonderful platform. my scanner requirements is such that i want to round index to nearest 50 or 100 after 9:30.
i want a alert after 9:30 am whenever index is at 22550 or 22600 or 22650 so on. i.e. when nearest strike of 50 or 100. i would appreciate if you can provide this.
thank you.
Hi Chart Ink, I am trying to make a filter in which I can identify if the stock is closed near 70% or higher of it’s range, can you help? I tried close-low/high-low >= 0.7 but it does not work. Please could you help me with this
Hi Chart Ink, I am trying to make a filter in which I can identify if the stock is closed near 70% or higher of it’s range, can you help? I tried close-low/high-low >= 0.7 but it does not work. Please could you help me with this.
Hi Chart Ink, I am trying to make a filter in which I can identify if the stock is closed near 70% or higher of its range, can you help? I tried close-low/high-low >= 0.7 but it does not work. Please could you help me with this?
Hello,
I assume you are looking for the latest close is near 70% and above form the high of the candle.
If so, here is your scan; kindly review it:
https://chartink.com/screener/latest-close-is-near-70-and-above-form-the-high-of-the-candle
SIR CAN YOU CREATE A SCANNER FOR ME WHERE LATEST PRICE IS NEAR ABOUT SUPPORT OF RESISTANCE (DOUBLE TOP OR DOUBLE BOTTOM) IN 1 HOUR TIME FRAME OF PREVIOUS 100 CANDLES & LATEST CANDLE FRAME DRAGON FLY DOGI OR GRAVE STONE DOGI.
Hello,
Could you please share a sample chart image for reference so that we can try to create a scan for you?
Hi,
can we modify the below scanner to meet below criteria in daily timeframe.
1. yesterday candle is red and todays candle closes above the red at 3.30 pm.
2. Price range between INR 300 and INR 1000.
https://chartink.com/screener/24th-15-minute-close-25th-15-minute-close-24th-red-25th-green-15-minute-time-frame
Hello,
Here is your scan in a daily timeframe; kindly review it:
https://chartink.com/screener/yesterday-candle-is-red-and-todays-candle-closes-above-the-red-in-a-daily-timeframe
Hi Chartink ,
Can I get a scan for average volume of 3 days greater than 100K?
Thanks
Hello,
Here is your scan, kindly review it:
https://chartink.com/screener/average-volume-of-3-days-greater-than-100k
Hello can u help me build a scanner where weekly and monthly timeframe ichimoku chikau line is above price and cloud and on daily timeframe ichimoku chikau has just crossed the price and cloud with price challenging upper BB and RSI above 55 along with ADX above 14.
Hello,
Could you please share a sample chart image for reference so that we can try to create a scan for you?
conditions to be met-
1) Ichimoku Lagging span on weekly and monthly time frame should be above cloud and price
2) Ichimoku lagging span on daily should have just crossed above cloud
3) RSI on daily above 55
4) ADX above 14 on daily
Scan is to be created with Ichimoku lagging span / Chikau span. Dont create scanner with Ichimoku span A and Ichimoku Span B. Ichimoku lagging is closing price past 26 day period.
Hello Ankur, Thank you for these details, Below is your required scanner, Kindly review – https://chartink.com/screener/ichimoku-lagging-span-chikau-span
Hi,
I want to create a scanner for which following condition to be met.
1. previous 5 min Bollinger band squeeze (narrow range) for atleast 20 mins
2. latest 5 min candle closes above 5 min upper Bollinger band
3. latest 5 min volume > 2.5 times last 20 min
4. latest RSI > 60
Hello,
Below is your required scanner, Kindly review –
https://chartink.com/screener/scanner-for-anup-band-squeeze
thnk you so much….
1 more query, today i have ran it…. O
On 9.15 AM there were no any stocks scanned but in backtest report (XLS sheet) @ 9.15 am there were 28 stocks.
Is the scanning is lagging ?? It may enter us late in stock.
Pl clarify,
Hi Team,
Can you please advise why this scan failed picking up Apollo Hospital?
The average of previous day last two candles (1 min) is 3893.5 as per TradingView data, which multiplied by 10 is 32935 which is less than todays first 1 min candle 43476.
https://chartink.com/screener/new-1-minute-new-1
Hi Ravish,
This seems to post-adjustment issue for this particular stock, Could you please try with another stock and let us know? You can reach out to us on – [email protected]
Hi Sourabh,
What’s a post-adjustment issue. It picks up the value when I multiply by 6. Can you check the volumes at your end for the last two candles.
Hi Ravish, Apologies for the delayed response –
As there’s high volatility in the last 15 minutes, NSE considers the WMA for the last 15 minutes for the stocks close price, this price is then sent out in the bhavcopy or the price list of the stock available 6pm onwards on nseindia.com
Hello support, can u make a scanner in which MACD line and MACD signal line both stay near zero line for a long time or u can say remain in consolidation phase.
Hello,
Here is your scan; kindly review it:
https://chartink.com/screener/macd-line-and-macd-signal-line-both-stay-near-zero-line-from-last-20-days
near 0 line ka matlab nahi pta kya yr. kuch bhi bna kar de deta he . Dimag to lgao thoda
Hello,
I’ve created another version for the MACD line to be within 0.5 (+/-) of the histogram for the last 20 candles. Kindly review:
https://chartink.com/screener/last-20-candles-around-macd-histogram
Hi,
Good Afternoon,
Sometime time back, in the comments, I came across a scanner with the description
“Current volume is greater than the maximum of 10 down days volume”
Unable to find it again.
Can you please provide it again adding below criteria to it.
1. Todays open is 2% greater than yesterdays close.
2. Price INR 100 to INR 3000.
Thanks in advance
Hello,
Here is your scan, kindly review it: https://chartink.com/screener/todays-open-is-2-greater-than-yesterdays-close
thnk you so much….
1 more query, today i have ran it…. O
On 9.15 AM there were no any stocks scanned but in backtest report (XLS sheet) @ 9.15 am there were 28 stocks.
Is the scanning is lagging ?? It may enter us late in stock.
Pl clarify,
You are welcome,
This could probably be because of a scan or an alert misconfiguration which we could investigate and correct; please share the following details on “[email protected]”
:
URL of the scan that you are referring to?
Share a few example stocks with us for which you should have received alerts but did not get alerts for the same.
Share a screenshot of the alert settings for your scan. You can do so by opening your scan and clicking on the “modify alert” option and sharing a screenshot of the same here for our reference.
Hi , I am confused on how to make the scanner for ‘this week’s volume more than previous week’s volume’.
Please reply as soon as possible.
Thanks !
Hello,
Here is your scan, kindly review it:
https://chartink.com/screener/this-week-s-volume-more-than-previous-week-s-volume
Hi,
Can you please provide a scanner as per below criteria.
1. Timeframe : Daily
2. Day 1 : Forms Red candle but stays above 10ema
3. Day 2 : Forms Green candle and closes above the Day 1 red candle
4. Day 3 : Opens 2 % more than the Day 2 closing price
5. Price range : INR 100 to INR 3000
Hello,
Here is your scan; kindly review it:
https://chartink.com/screener/todays-open-greate-than-yesterday-close-by-2-in-daily-timeframe
Please note that we have considered here :
Day3 = Latest Day
Day2= 1day ago
Day1 =2days ago
Can You Help me to find the stocks which are up 50%-100% within 4 to 6 weeks?
Can You Help me to find the stocks which are up 50%-100% from 52 week low within 4 to 6 weeks?
Please Ignore the above message
Hello,
Sure, Thank you for the update.
Help me to find the stocks which are up 50%-100% from 52 week low within 4 to 6 weeks?
Hello,
We have tried to create a scan for you, kindly review it:
https://chartink.com/screener/the-stocks-which-are-up-50-100-from-52-week-low-within-4-to-6-weeks
i Appriciate You Tried,
But its not that accurate
Hello Vishal,
Apologies for the confusion, I have modified your scan, I belive you want to the stock should in range 50% to 100% up move from 52 weeks(252 days) –
https://chartink.com/screener/stocks-which-are-up-50-100-from-52-week-low-within-4-to-6-weeks
Dear sir,
Can you guide me on how to make a scanner with following condition:
Lifetime MONTHLY RSI(14) should have first time crossed 50, it should have never crossed above 50 before.
Hello,
Currently, we do not have a Lifetime/All-Time feature. We need to enter the “n” number of previous candles to check the results. Is it ok for you if RSI crosses 50 after 60 days?
If so, here is an example scan; kindly review it:
https://chartink.com/screener/rsi-above-50-after-60days-in-daily-timeframe
Here is your scan; kindly review it:
https://chartink.com/screener/todays-open-greate-than-yesterday-close-by-2-in-daily-timeframe
Please note that we have considered here :
Day3 = Latest Day
Day2= 1day ago
Day1 =2days ago
Hi,
Referring to above scanner, I would like clarify the below points. kindly modify the scanner if required.
Day3 = Latest Day – 9.10 am ( When pre – open market closes, stocks from Day 1 list open 2% greater than Day 1 closing)
Day2= 1day ago – 3.30 pm
Day1 =2days ago – 3.30 pm
Hello,
Please find the response below:
You will need to manually run the scan and view the results with candles, including pre-market values.
Data is updated at 9:09 am in our scans for our Daily/Weekly/Monthly/Quarterly & Yearly candles. Note that for Intraday candles(1/2/3…minutes), data would reflect starting at 9:15 am.
Help me to find the stocks which are up 50%-100% from 52 week low within 4 to 6 weeks?
Dear Sir, Very good morning..!! Can you please help me understand how to filter stocks with public shareholding less than 25%. Thank you.
Hello,
Here is your scan, kindly review it:
https://chartink.com/screener/public-shareholding-less-than-25
Hello,
I have taken the premium subscription. I am looking for a dump of all the filters in an Excel sheet (or some other offline format), so that I can avoid scrolling when trying to make filters. It will also help me in studying and understanding what all options are available and help me design better filters/formulae.
Regards
Rajneesh
I have been trying to scan for stocks that are above 200-dma consistently for the last months (candle to be used is daily candle). I couldn’t get it working. Kindly review this and provide feedback – https://chartink.com/screener/test-scan-consistently-up
Hello,
Here is a modified scan, kindly review it:
https://chartink.com/screener/modified-test-scan-consistently-up-and-consolidating
Thank you !
Hi,
I am trying to back test my strategy manually.
Is there a way to write this formula in chartink where I want to find stocks which is,
“up X% within Y days within the last 100 bars”
Thanks in Advance
Hello,
Here is an example scan for the last 10 days maximum close is greater than 100 days maximum close from 10 days ago by 5%. Kindly review it:
https://chartink.com/screener/last-10-days-close-is-greater-than-100-days-maximum-close-from-10days-ago-by-5
Hi,
Thanks for the reply.
In the above scanner, it filters for stocks 10 days ago only.
My requirement is, I want all the stocks that have gone up by 20% in 10 sessions, within the last 100 days
It can be ANY consecutive 10 trading sessions in the selected 100 bars.
For example, if the 100 bars are from March to May, the stock could have gone 20% from 1st of March to 10th of March. That should be in the result.
Stocks gone up from 10th of April till 20th of April should also be in the result. Etc..
Will this be possible?
TIA
Hello,
Thank you for the clarification. Here is your scan for the same. Kindly review:
https://chartink.com/screener/in-the-last-100-days-stock-moved-more-than-25-within-10-days
This is the one. Thanks a lot!!!!
Hi Chart ink Team,
I must first admit this is a fantastic platform and a big applauses to the team.
Can you help me to create a scanner based on the following requirements.
Stock price should be 12% up in the last one month trading period, price should be above 200DMA, 50DMA, above 20EMA .
The price change of the latest close should be less than 1%
Volume should be higher than 50000.
I am not sure where we can add ADR if it can , please select the stocks which have more than 3 ADR.
Thank you
Sai
Hello,
Here is your scan for the same. Kindly review:
https://chartink.com/screener/scan-for-sairaj-2
It is not very clear what you mean by ADR. Are you referring to the ATR here? Kindly clarify.
can u send me a scanner where bollinger band expands big egg.
Hello,
Here is an example scan for the same. This checks for the last 5 candles to have a big Bollinger band in a 15-minute timeframe:
https://chartink.com/screener/big-bollinger-band-formation-in-the-last-5-candles-15-minute-timeframe
I’m trying to create a screener to find stocks above 80% of its all time high price. Using the following query
latest high >= monthly max ( 150 , monthly high ) * 0.8
I’m observing that this screener filters out all stocks which don’t have 150 months worth of data. I think the Functional filters (min/max) should be smart enough to consider this case, and allow for stocks that came out recently as well.
Can you please let me know if my query has an issue, or is this a bug?
Hello,
The filter should be like this: Monthly Close >= 1 month ago Max ( 150 , Monthly High ) * 1.80
Here is your scan; kindly review it:
https://chartink.com/screener/current-price-greater-than-last-150-months-high-price-by-80-in-monthly-timeframe
Hi, thanks for the quick reply. But The query is not giving the results I expect. Following are my requirements:
Latest close >= 0.80 * All Time High price AND market cap between 1000 and 50000 cr.
I edited the query you shared to this:
Latest Close >= 1 month ago Max ( 150 , Monthly High ) * 0.80
Market Cap >= 1000
Market Cap 0.80*High price all time AND
Market Capitalization >1000 AND
Market Capitalization <20000
It returned around 300 stocks, while chartink returns around 150.
You can use this stock as reference:
Harsha Engineers International Ltd
This stock should be present in the output
can we screen EMA 10, EMA 20, EMA 100 and EMA 200 at a time?
If yes then please guide.
Hello,
Your query is not clear. Could you please elaborate more on “can we screen EMA 10, EMA 20, EMA 100 and EMA 200 at a time”?
I want to create 2 hrly scan where I want to remove first 15 min so I can have 3 candled of 2hrs each day and scan if 2 hrly candle has any volume spike compared to last 50 candles , how to remove first 15 min
Greetings!
At this moment, we do not offer the feature you mentioned. Nonetheless, we are actively exploring the option of adding it along with new indicators.
I am unable to provide a specific timeline for the addition of this feature, but I have forwarded your request to our Development team for future consideration.
We value your patience and look forward to enhancing our service for our valuable users.
Hi,
I run 2 scans in a single Atlas screener.
How to remove the stocks from the 2nd screener which has already shown in the 1st screener? Like, I do not want the stocks to repeat
TIA
Hello, Please provide us with the URL/link to your dashboard on ‘[email protected] so we can review it and respond accordingly.
Hi,
This is the screener https://chartink.com/dashboard/165506
I have 3 scans —> 1 month, 3 month and 6 month.
I don’t want the stocks to be shown repeatedly.
For example, if suppose the stock ‘reliance’ follows the conditions in the 1 month and 3 month scan, it shows up in both the scans. I just want a condition in the 3 month scan where, if ‘reliance’ exists in 1 month scan, then don’t display in the 3 month scan.
Hope you understand.
Thanks
I am not sure how to write for this scan. My requirement is to find stocks that have registered 25% or more price increase with consecutive green candles only (any number of them but consecutive) during any point of time in the last 200 days. This 25% is from the low of the first green candle in the series to the high of the last green candle in that series.
Can you please help me if possible ?
Hai,
Hope the team is doing fine.
Is it possible to create a scanner based and Stochastic Indicator as per below parameters.
Stochastic Setting : Over bought setting 75
Over sold setting 25
Scan Parameters: Positive breakout cr0ssing 25
Time Frame: 15 min and Daily (2 scans)
Volume : Greater than the maximum of 10 down days volume
Hello, Here is your required scanner, Kindly review – https://chartink.com/screener/stochastic-crossing-above-to-25-on-daily-candles
https://chartink.com/screener/stochastic-crossing-above-to-25-on-daily-candle
kindly provide the same in 15 min time frame
Dear sir,
will you please create Demand zone scanner (RBR/DBR) on 75mnt Time frame.
Thanks
Hello,
Could you please share the chart image here to show “Demand zone” so that we can try to create a scan for you?
sure I have sent you mail of demand zone photo on 75mnt Time frame,
please check .
Thanks
I need a scanner for “virgin Value area High” “value area low” “point of control”
This terms are from Fixed range Volume profile indicator/session volume profile indicator
Hello,
Apologies, but I’m afraid that your message isn’t entirely clear. Could you please provide more details on what you are referring to? It would be helpful if you could share an example image highlighting the same for reference purposes. This way, we can better understand your request and create a scan that meets your requirements.
You can share the details directly with us via email at – [email protected]
is there a way to include multiple conditions in Count/Groupcount functions.
for eg. I want to scan stocks with 5 or more candles with each candle % change is >2% and volume > 10000 in last 10 sessions.
if this is possible, can you provide me a scan for this.
Hello,
Sure, this is possible with the help of the nested count. Here is a scan for the same:
https://chartink.com/screener/5-or-more-candles-having-change-2-volume-10000-in-the-last-10-days
This helps!
Thanks a lot..
is there any parameter to get Pre-open price & volume in chartink
Hello,
Are you referring to the Pre-market Open and volume of stocks? Kindly confirm.
yes
Hello,
You could plot these on an Atlas dashboard. Here is an example dashboard for your reference:
https://chartink.com/dashboard/180884
Thank you!!
Sir,
I want to scan 1st 15mnt candle close is greater then (previous day close And EMA15)
i want to use “AND” function
please tell me how to use “AND” function in chartink
Hello,
You can write 2 conditions and the scan will ensure it will show results only when both the conditions are true. Here is an example scan for your reference:
https://chartink.com/screener/1st-15-minute-candle-greater-than-previous-day-s-close-ema-15
I need help and hire expert to create cpr based scanner
Hello,
Here is an example scan for the same,, kindly review it:
https://chartink.com/screener/5min-close-breaks-daily-upper-cpr
i want create scanner rsi and ma length both is 14 and cross over weekly basis bull and bear side
thanks
Hello,
Here is an example scan scan, kindly review it:
https://chartink.com/screener/rsi-14-crossed-above-sma-14-of-rsi-14-in-daily-timeframe
Hi , I want to make scanner , but 1st i need sector bullish filter using RSI & same filter sector i need to find stock which are bullish same using RSI
How can i group sector + stock together in same scanner ?
Hello,
Your requirements are not clear. Are you looking for the Relative strength indicator?
If so, at this moment, we do not have this feature. Nonetheless, we are actively exploring the option of adding it along with new indicators.
I am unable to provide a specific timeline for the addition of this feature, but I have forwarded your request to our Development team for future consideration.
We value your patience and look forward to enhancing our service for our valuable users.
how to scan the particular day candle is not more than 2%
Hello,
Here is your scan, kindly review it:
https://chartink.com/screener/the-particular-day-candle-is-not-more-than-2
Hi,
If i want to get alerts as soon as the current market price is higher than the high of first candle, how to go about it? Does chartink give current market price as a parameter? because i was able to find only the OHLC prices and not current market price?
Hello Sachin, Here ‘0’ refers to the current candle or latest candle on a minutes timeframe, whereas ‘=1’ refers to Day first candle. Eg Specific number of candles in a day can be accessed using this offset, for e.g If we want to access the 5th candle from the start of the day on a 5 minutes timeframe we can use the offset as ‘[=5] 5 minute.
Hi,
What is the difference between offset 0 and nth candle =1???
What is the difference between offset ‘0’ and nth candle ‘=1’
Hi , I want to make scanner , RSI below 50 and PVI crossed below PVI SMA(20)
Hello Bejoy,
I have create a scan based on the RSI condition, Kindly reivew – https://chartink.com/screener/rsi-below-50-193
Note that, currently, it is not possible to create this indicator, as you noticed in the formula (https://www.investopedia.com/terms/p/pvi.asp#:~:text=The positive volume index (PVI) is an indicator used in,positive increases in trading volume.) it requires previous positive volume index, which is self-dependent on itself, hence it is not possible to create the same.
InvestopediaInvestopedia
Positive Volume Index (PVI): Overview, Examples, and Formulas
The PVI is an indicator used in technical analysis that provides signals for price changes based on positive increases in trading volume.
InvestopediaInvestopedia
Positive Volume Index (PVI): Overview, Examples, and Formulas
The PVI is an indicator used in technical analysis that provides signals for price changes based on positive increases in trading volume.
Sir Please Give me a Intraday Trading Scanner which is 5 Minute Candle Crossed above and below Vwap & Previous day high & Previous day low breakout
Hello,
Here are your scans, kindly review them:
1. https://chartink.com/screener/5min-close-crossed-above-vwap
2. https://chartink.com/screener/5min-close-crossed-below-vwap
3. https://chartink.com/screener/5min-close-breaks-previous-day-high
4. https://chartink.com/screener/5min-close-breaks-previous-day-low
Hello,
I am having a problem in filtering results got through scanner.
In my scan I have a specific candlestick pattern with different timeframes. I have 6 filters for 6 timeframes.
When I get results it all mixed up.
Can i get results (in .csv) with filter headlines so I can know at a glance ” which filter the scanned results belongs to”.
It will be great to have an option to put headlines to filters.
Greetings!
At this moment, we do not offer the feature you mentioned. Nonetheless, we are actively exploring the option of adding it along with new indicators.
I am unable to provide a specific timeline for the addition of this feature, but I have forwarded your request to our Development team for future consideration.
We value your patience and look forward to enhancing our service for our valuable users.
Wait for candle close?
I’m using condition 5 mins close cross below pivot point, however, it does not wait for the 5 minute candle to close.. it enters in the middle of candle forming. Also, on 15 minute candle condition, it will enter 2-3 times (eg: 9:20, 9:25) when it should enter at 9:30
Hello,
Apologies, but I’m afraid that your message isn’t entirely clear. Could you please provide more details on what you are referring to? It would be helpful if you could share an example image for reference purposes. This way, we can better understand your query better.
You could directly share the details via email to – [email protected]
Hello Chartlink Support ,
Can you please provide me a scanner where chart is taking a Monthly Support on level (21 and 9). in the past 2 months.
Thanks in advance.
Puneet
Hello,
Apologies, but I’m afraid that your message isn’t entirely clear. Could you please provide more details on “Monthly Support on level (21 and 9)”?
It would be helpful if you could share an example image for reference purposes. This way, we can better understand your request and create a scan that meets your requirements.
Hii Sir, is it possible to create a filter where stock volume was dried up for the previous 10-15 days or more than that?
ADDITION IN MY PREVIOUS QUESTION
Filter stock with volumes dried up in past or having downtrend in volume or anything that shows contraction in volume?
Hello,
Apologies, but I’m afraid that your message isn’t entirely clear. Could you please provide more details on what you are referring to? It would be helpful if you could share an example image for reference purposes. This way, we can better understand your request and create a scan that meets your requirements.
actually i have made a scanner for stocks that have given breakout of my level on 1D timeframe. Now i just want to add a filter that before breakout the volume was dried (quite low) or continuously decreasing means the volumes are contracted… Can we create sucha filter?
Hello,
Yes, you can create a condition where the volume is continuously decreasing for the last 5 days. Below is the link for the same. Kindly review.
https://chartink.com/screener/volume-was-dried-quite-low-or-continuously-decreasing-means-the-volumes-are-contracted
Suppose you want us to modify your scan and add the above condition to your scan. Please send your scan link. So we can modify for the same.
which time frem i use to stock watch..?
Apologies, but your query is not very clear. Can you please elaborate a bit more on what you are trying to achieve here exactly?
hello,
will you please create a scanner which shows stock which has given a breakout to their resistance and after breakout the stock is retesting its breakout zone with sign of reversal on weekly time frame, you can create the same on daily and month TF or guide me to create in different TFS,
shortly speaking I want scanner which has given breakout on weekly and now retesting \
Thanks
Hello,
Please share a sample chart image highlighting the same so we can help create a scan for the same accordingly. Please share the image directly via email to – [email protected]
i need your support
Plz provide multibagger stocks
Hello,
Please note that we do not provide any scan or stock recommendations here. We provide the scan support where our user share their scan requirements and sample chart image for our reference so that we can try to create a scan for them.
If you need help creating a scan, please share your requirements and a sample chart image, and we shall create the same for you.
Hello,
If you need help creating a scan, please share your requirements, and we shall create the same for you.
Also, please find our tutorials,
Scans: https://chartink.com/articles/scanner/scanner-user-guide/
Alerts: https://chartink.com/articles/alerts/alerts-guide/
Desktop notifications: https://chartink.com/articles/alerts/desktop-mobile-a-k-a-web-notifications/
Web-hooks: https://chartink.com/articles/alerts/webhook-support-for-alerts/
You can also start by reviewing our top scans here: https://chartink.com/screeners/top-loved-screeners. They contain the top 10 scans used for Intraday/Swing & short-term trading.
Hello,
Apologies, but I’m afraid that your message isn’t entirely clear. Could you please provide more details on what you are referring to? It would be helpful if you could share an example image for reference purposes. This way, we can better understand your request and create a scan that meets your requirements.
i want a scanner where first 10 minute candle make open equels to low but some time that break its low and touch only .05 to .20 point. please make this type of scanner.
Hello,
Apologies, but I’m afraid that your message isn’t entirely clear. Could you please provide more details on what you are referring to? It would be helpful if you could share an example image for reference purposes. This way, we can better understand your request and create a scan that meets your requirements.
Hello Sir/Madam,
I am trying to make a scan for volume change in SME stocks. Watchlist is not working in SME names. Please guide.
Hello,
At this time, we do not offer support for SME stocks. Our platform exclusively supports NSE cash stocks and indices only. However, we have plans to include Other/Global stocks and indices in the near future.
Please create Piotroski F Score indicator or atleast provide screener. Piotroski F Score is available on all major screeners but not available on Chartink, so please create.
first take latest 15 high crossing (Daily Range = High – Low )
the today open plus Take previous 10 days daily range and divide by 10 then divide it by 2 please help me to do this
final look 15 minute greater than Open + ADR10/2
Hi,
How is the indicator Bollinger Bands %b calculated?
Is it (upper band – Lower Band)*100/(Lower Band)
Hi , how to calculate “X power Y” OR “exponential ( N)” in Chartink . don’t find any function available.
Greetings!
At this moment, we do not offer the feature you mentioned. Nonetheless, we are actively exploring the option of adding it along with new indicators.
I am unable to provide a specific timeline for the addition of this feature, but I have forwarded your request to our Development team for future consideration.
We value your patience and look forward to enhancing our service for our valuable users.
Hi,
I want to filter out IPO stocks listed within 1 year which are exhibiting highest volume since listing. Kindly make a scanner as unable to do it.
I have created one for stocks older than 1 year displaying highest volume- https://chartink.com/screener/highest-volume-ever-or-in-one-year
Thanks
Hello,
We have created the scan. Kindly review.
https://chartink.com/screener/ipo-within-1-year-and-the-volume-is-high-today
Note: The above scan will show you stock that are listed within 1 year, and the current volume greater than SMA 20 volume.
Hi
A question ; The volume parameter in the stock attributes refers to traded volume? If yes how can I get delivery volume as a stock attribute if I want to create a scanner where delivery volume is one of the scan parameter?
Greetings!
At this moment, we do not offer the feature you mentioned (delivery volume). Nonetheless, we are actively exploring the option of adding it along with new indicators.
I am unable to provide a specific timeline for the addition of this feature, but I have forwarded your request to our Development team for future consideration.
We value your patience and look forward to enhancing our service for our valuable users.
Hi, do you have the delivered volume data?
Hello,
Currently we do not have the delivery volume feature. We will surely let you know if there is any development on this in the near future.
Write a screener code to find stocks volume during pre market(9:08 to 9:14 AM) opening.
Hello,
Apologies, but your query is not very clear. Could you please elaborate a bit more on what you mean by ” to find stocks volume during pre-market (9:08 to 9:14 AM) opening.”?
Do you only want to see the -premarket volume for stocks? Kindly clarify.
hello sir
i want to creat scan for cross for EMA in fifty what formula for it..i cant uderstand to creat..pls guide
Hi Sir,
Was trying to understand one of the scan examples. Can you please clarify if Statement 1 and 2 will give the same results. I am little confused with Statement 1 –
Statement 1 )
1 day ago Max ( 5 , latest Close ) < latest Max ( 20 , 10 days ago High )
Statement 2)
1 day ago Max ( 5 , latest Close ) < 10 days ago Max ( 20 , latest High )
Thanks
Hello Srinivas,
Your understanding is correct. Both statements should give the same results. But for better understanding, use the second statement.
I want scanner which with large volumes in last 15mins of market closing and next day open with gapup.
Hello,
We have created the scan. Kindly review.
https://chartink.com/screener/gap-up-with-high-volume-on-the-previous-day-s-last-15-minute-candle
Note: The above scan will show you the previous day’s last 15-minute candle to have the maximum volume through the day and a gap-up on the current day.
How can I create a filter with text value? For e.g. I want to create a scan with certain filters on a specific sector. There is a sector attribute, but how do I specify a text value for it?
There are other textual fields too, like Symbol, Industry etc. How to create filters on those?
Also, is there a guide/page which describes each field in brief? For e.g., for market cap, there seem to be 2 fields, so which 1 to use? And are they in rupees, lakhs or crores?
Is there a page which has such information for all the fields?
Ideally, it would be nice if on the screener page itself, there would be a tooltip on each field, which gives a brief info about it.
Hello Vishal,
Explanation for sector:
The below scan will show you all the stocks inside the pharmaceutical sector.
https://chartink.com/screener/scan-to-access-pharmaceutical-sectors
Note: To access any sector, you need to follow the same syntax of the above scan.
Explanation for market cap field.
Make sure to use the market cap, which is from legacy fundamentals. The other filter is named ‘marketcapname’, which will show you whether the stock belongs to the small, mid or large cap. The market cap is set at default in crore. The below scan will show you a market cap greater than 20,000, i.e. large cap.
https://chartink.com/screener/market-cap-to-access-large-cap-stocks
Explanation for tooltip:
At this moment, we do not offer the feature of a tooltip, as you mentioned. Nonetheless, we are actively exploring the option of adding it along with new indicators. We are unable to provide a specific timeline for the addition of this feature, but we have forwarded your request to our Development team for future consideration. We value your patience and look forward to enhancing our service for our valuable users.
In the meantime, you can check out recent updates, which will include user-friendly charts and many more new indicators.
https://twitter.com/ChartinkConnect/status/1710878207589974477
Kindly add Marketcap field in results besides Sr., Stock, Name, Symbol, Links, % Chg, Price, Volume
Hello NEMO,
We apologize, but currently, we do not offer the feature of a custom-made result section, as you mentioned in your message. But this can be achieved with the atlas dashboard. Below, we have created the same. Kindly review.
https://chartink.com/dashboard/200535
In the meantime, you can check out recent updates, which will include user-friendly charts and many more new indicators.
https://twitter.com/ChartinkConnect/status/1710878207589974477
how i can create rsi as a custom indicator in chartink.
Hello,
We do not have the feature for the custom made RSI.
Hello
I want to know the maximum and minimum daily closing levels in a monthly candle.
Hello,
Below is the chart snapshot for the same. Kindly review.
https://chartink.com/stocks-new?load-snapshot=maximum-daily-close-in-month-minimum-daily-close-in-a-month-chart-snapshot
Note: The above snapshot will show you the maximum and the minimum close in the last 20 days.
HAI I NEED EMA(12) AND EMA(36)…. THE CONTENT EMA 12 CROSS ABOVE EMA 36 LINE AND RETURN CANDLE TOUCH EMA 12 LINE…. ADX LESS THAN 40 ISPOSSIBLE AH SIR…
Hello,
We have created the scan. Kindly review.
https://chartink.com/screener/ema-12-cross-above-ema-36
hello , days ago means calender days or daily bars ( irrespective of weekends or holidays ) ?
Hello,
The scan will only consider the active trading days. The scan will exclude the weekends and holidays.
Dear Sir,
I am trying to create scanner which gives the “stocks with narrow CPR for next week & next month” but i’m unable to do it.
can you please create it ans send sir. It would be of great help and support.
Thank You
Hello,
This can be done with the help of a custom indicator/formula. Here is an example scan for your reference:
https://chartink.com/screener/narrow-cpr-for-next-week-next-month
Note: For the weekly, the range is 1%, and for monthly, it is 2%.
To use this custom indicator, you can “Copy scan” scan & make changes. You can view the logic of the custom indicator by clicking on the purple sign(>>) next to the indicator.
Also, you can create your own custom indicator by copying/pasting the logic from the indicator shared here: https://chartink.com/indicator
Once you create your custom indicator, it should be visible in the dropdown list under “derived/custom indicators”. Here is a short video on how this can be done.: https://drive.google.com/file/d/1bnr1ahmajyXIpBRE69ese60sm7541-14/view?usp=sharing
I am trying to create scan for stocks withing 10 % or range last close for last 60 days.
Can you please help me.?
Thank you
Hello,
Sure, here is a scan for the same. Kindly review:
https://chartink.com/screener/10-range-for-the-last-60-days
Is there a way to isolate stocks from a particular sector like Nifty Bank or CNX Auto and apply the scanner to it?
Hello,
For this, you can create a watchlist and run the scan against that watchlist. You may create a watchlist here (https://chartink.com/watchlist/create) and run the scan against the watchlist.
If you wish to know more about the process for the same. You can write us the same query at this email address: [email protected] Since we cannot upload image to the comments.
Hello,I want On Board Volume scenner with the condition:If today is the least OBV within last 90days(1Day time scan)
Hello Ravikant,
Based on your provided input, Below i have created a scanner for you, Kindly review –
https://chartink.com/screener/today-is-the-least-obv-within-last-90days-1day-time-scan
HI..I WANT TO KNOW,CAN WE GET SCANNER FOR PRICE APPROCHING QUATERLY FIB LEVEL 1.6
Hello,
Sorry, but your query is not very clear. Could you please elaborate more on the same and, if possible, share a sample chart image for reference?
Hi team,
Any update on the Relative strength indicator as it is being asked from past one year.
Do you have it in the current roadmap?
Hello,
Yes, we do plan to include this and we are in process of getting this done. We will surely keep you posted as and when this is available.
We value your patience and look forward to enhancing our service for our valuable users.
any ETA?
sir I love scanning in stock is very setisfied in this but also need scanning in Nifty Banknifty and other option trading index,so plz if have send me feedback to mail,
thank u
Hello,
We currently support only NSE cash stocks and indices; we have created a segment group named ‘futures’ to scan stocks traded in the F&O group. If you select futures, scanning will be done based on cash stock prices/ values.
HOW TO TYPE DAY NTH CANDLES(=1)
Hello,
[=1] this will give you the day’s first candle. This [=2] second and so on.
Hi Team,
I’m trying to create the below filters, any help would be appreciated
“Average 7 day Volume/Average 63 day volume”
And I ended up creating this
( ( 7 days ago Close + 6 days ago Close + 5 days ago Close + 4 days ago Close + 3 days ago Close + 2 days ago Close + 1 day ago Close ) / 7 ) / ( ( 63 days ago Close + 62 days ago Close + 61 days ago Close + 60 days ago Close + 59 days ago Close + 58 days ago Close + 57 days ago Close + 56 days ago Close + 55 days ago Close + 54 days ago Close + 53 days ago Close + 52 days ago Close + 51 weeks ago Close + 50 days ago Close + 49 days ago Close + 48 days ago Close + 47 days ago Close + 46 days ago Close + 45 days ago Close + 44 days ago Close + 43 days ago Close + 42 days ago Close + 41 days ago Close + 40 days ago Close + 39 days ago Close + 38 days ago Close + 37 days ago Close + 36 days ago Close + 35 days ago Close + 34 days ago Close + 33 days ago Close + 32 days ago Close + 31 days ago Close + 30 days ago Close + 29 days ago Close + 28 days ago Close + 27 days ago Close + 26 days ago Close + 25 days ago Close + 24 days ago Close + 23 days ago Close + 22 days ago Close + 21 days ago Close + 20 days ago Close + 19 days ago Close + 18 days ago Close + 17 days ago Close + 16 days ago Close + 15 days ago Close + 14 days ago Close + 13 days ago Close + 12 days ago Close + 11 days ago Close + 10 days ago Close + 9 days ago Close + 8 days ago Close + 7 days ago Close + 6 days ago Close + 5 days ago Close + 4 days ago Close + 3 days ago Close + 2 days ago Close + 1 day ago Close ) / 63 ) >= 1.05
Is there a shorter and easier way to do if for different time period?
Also I want to know if we can create a filter like %change between 1 and -1?
And filter allowing Average 7 day volume < Average 1 month volume ?
Hello,
Please find our response below:
1) In the formula, you are comparing the volume, but in the breakdown, you are comparing the close. We have sent the dashboard for this request in another comment; please let us know if that helps.
2) We have created the scan. Kindly review.
https://chartink.com/screener/change-between-1-and-1
3) We have created the scan. Kindly review.
https://chartink.com/screener/average-7-day-volume-average-1-month-volume
2DAYS HIHEST HIGH
2DAYS LOWEST LOW
Hi,
Can someone please help me with formula for “Average 7 day Volume/ Max 3 months volume”
Hello,
We have created the dashboard. Kindly review.
https://chartink.com/dashboard/215549
Hello,
I have below scanner
https://chartink.com/screener/copy-best-backtested-by-neeraj-new-multibagger-stocks-screener-8
Which is not returning any stock in given criteria, until dec we can se data. As of 1st Jan 2024 there is no data. Can you tell me any specific reason for that.
Thank you.
Hello,
We have modified the scan as per the correct syntax. Kindly review.
https://chartink.com/screener/best-backtested-by-neeraj-new-multibagger-stocks-screener-modified
Note: The scan seems to be working fine. If you are referring at 02/01/2024, then we were facing some issues related to our latest monthly candle which is fixed as of now.
How to do back test?Where is the link?
Hello,
Here is the link that will offers a detailed guide on the backtest: https://chartink.com/articles/uncategorized/backtesting-now-available/
If you are looking for the backtest of the scan. Please click on the pink button, which you will find at the rightmost place when you save the scan named “Backtest Results”
How to set a scan where I can set that the closing price on a daily timeframe is greater than 50 days EMA for last two months ?
Hello Team,
I need Scanner for Following. Can you help me with the Same?
1. Inverted Head and Shoulder on Daily Time Frame
2. High Tide Flag on Daily Time Frame
3. Stock Coming Out of Downtrend and getting its First Pull Back on Monthly Time Frame.
Regards
Hello,
Please find our response below:
1) We have created the scan. Kindly review
https://chartink.com/screener/inverse-head-and-shoulder-on-daily-candles
Note: Not all the stock in the above scan will show you the perfect pattern. Some stocks will be in the result section because they are fulfilling all the scan conditions. Kindly ignore them.
2) & 3 ) Please share the sample chart image for the mentioned requirements to this email ID: [email protected]
How to add Nifty and Banknifty futures in watchlist. Incase futures charts not available, how to create scan and alerts for 5 minutes 9 EMA and 5 minutes VWAP crossover on Nifty and Banknifty indices ?
Hello,
We have created the scan. Kindly review.
https://chartink.com/screener/ema-9-crossed-above-vwap-2
Note: The scan does not show any results for the indices.
Hello sir,
I need help in creating two scans. Is it possible for you to create same for me, or may be could you please provide the link if there is already existing one.
1st scan condition is :
1) I want to scan the stocks which are doing multi-year breakouts. e.g. breakouts after 5 years, 10 years, 15 years and so on.
2nd scan condition is :
1) I want to scan the stocks which are doing range breakout after 5-8 years breakouts. e.g. breakouts after 5 years, 10 years, 15 years and so on.
Basically I am a Momentum trader and want to trade which are doing breakouts based on above conditions.
Thanks and Regards
Aman
Hello,
We have created the scans. Kindly review.
1) https://chartink.com/screener/5-year-breakout-85
2) https://chartink.com/screener/5-year-range-breakout-2
Note: The second scan will show you the 5-year breakout only on the current day and not for the previous 20 days.
Hello i m part of your premium membership. Request you to kindly create scan as per below mentioned requirements –
1) on weekly or monthly time frame, find stocks that retraces upto 62%-78% of wave 1. That is scanner should find stocks that are currently doing ABC correction on weekly or monthly timeframe.
Hello,
Please share a sample chart image highlighting your requirements so we can accordingly help create a scan for you. You could share the details directly via email to – [email protected]
Hello i m part of your premium membership. Request you to kindly create scan as per below mentioned requirements –
1) MACD line and signal line both hover near zero line for long period say 1 month or more. U can say consolidation phase or sideways phase. Also MACD line and signal line should be narrow to each other and zero line.
Hello,
Here is an example scan for the same:
https://chartink.com/screener/macd-line-and-signal-line-near-0-for-20-days
Hello i m part of your premium membership. Request you to kindly create scan as per below mentioned requirements –
1) on Weekly timeframe, solid green hiekin ashi candle above 50 ema. 50 EMA should be rising i.e. slope of 50 ema should be up.
2) On daily timeframe, neutral hiekin ashi candle above 50 EMA . Color of neutral candle not matter. Be it green or red. 50 EMA should be rising i.e. slope of 50 ema should be up.
3) On hourly timeframe, Solid Green hiekin ashi candle formed doing fake break down of 50 EMA line.
4) On hourly timeframe RSI should be greater than 40
5) on hourly timeframe, stochastic should be doing positive crossover
6) On hourly timeframe, ADX should be rising and above number 15.
Hello,
Here is your scan for the same. Kindly review:
https://chartink.com/screener/scan-for-ankur-2
I want to Super Trader please guide how to help chartink. How to identify best option & short term share list please guide.
I want to subscripe prime chartink
Hello Lokesh,
Please note we do not provide any recommendations for scans or stocks here. We only provide a platform where traders can create scans and dashboards based on their strategy and filter out stocks that meet specific criteria.
We provide dedicated scanner support only to our “premium members,” allowing you to send your scan requirements and create and share the scan with you.
You review example scans or create your own scan by following our scanner guide here. Please note, Entry and Exit are totally up to you and your careful observations.
Hi,
This is the screener link https://chartink.com/screener/sma-200-2193
when we run it, it shows indices also in it when selected cash segment.
I want to exclude that.
Can you please provide the condition to be used.
Hello Ashish, We can achieve this in two ways. First, we can add a condition where the current volume is greater than 0. Alternatively, we can add “Close greater than 0” in the fail condition for the indice segment. Below, I have modified your scanner. Kindly review the changes.
https://chartink.com/screener/copy-sma-200-451
hello sir i want a scanner of “last 20days close above last 20days 20sma” and “last 20days 20sma in uptrend”
Hello Dhruv,
Based on your provided input, Below i have created a scanner for you, Kindly review –
https://chartink.com/screener/last-20days-close-above-last-20days-20sma
HOW TO ADD COLUMN IN MY SCAN RESULTS. I NEED TO SEE PE IN THE COLUMN
Hello,
Unfortunately, we do not have the feature for custom results section. But this is possible using the dashboard. We have created the dashboard. Kindly review.
https://chartink.com/dashboard/219944
Note: You can add the conditions of your scan in the filter section of the widget.
Hi Saurabh ji
Need Scanner
Intraday
Daily moving average 44 crossed
uptrend move
5 min time frame
Apologies, but I’m afraid that your message isn’t entirely clear. Could you please provide more details on what you are referring to? It would be helpful if you could share an example image for reference purposes. This way, we can better understand your request and create a scan that meets your requirements.
Please share the image on this email ID: [email protected]
mail sent from [email protected]
Need a Scanner
Intraday
5 min
22 EMA support or crossed
upward trend
future stocks
Hello,
We have created the scan. Kindly review.
https://chartink.com/screener/5-min-22-ema-support-or-crossed-upward-trend
Note: The above scan will show you the current candle taking support on the SMA 22 or the close is crossing above SMA 22 and at least the previous 5 candles are above SMA 22.
bullish fno stocks
Apologies, but I’m afraid that your message isn’t entirely clear. Could you please provide more details on what you are referring to? It would be helpful if you could share an example image for reference purposes. This way, we can better understand your request and create a scan that meets your requirements.
I’m trying to build a scanner with %K crossing over %D with settings as stochastic(55,34,21) in trading view. But when I give the same settings in chartlink, the values are very different. Please help?
Hello,
We have created the scan. Kindly review.
https://chartink.com/screener/k-crossing-over-d-with-settings-as-stochastic-55-34-21
hi
I need a scanner for narrow bollinger band for 10 days
Hello,
We have created the scan. Kindly review.
https://chartink.com/screener/narrow-bollinger-band-for-10-days
Note: The range is of 5%.
Please help me to create below scanner:-
Setup Scan:-
1. NSE stocks only
2. Average Volume of 20 and 100 days > 10 Cr
3. 20 MA is above 50 MA
4. Price > 50MA and 50 MA should not be trending down for a month
5. Price > 50 MA minus ATR(50)
6. Price >100 MA or 200MA
7. ATR(50) >=3 or stock part of Nifty(200)
8. Price GAP Oscillator of 20 days and 50 days should not be more than 2.5
9. (ATR(1) < half of ATR 5 or ATR 20 or ATR 50) or (Candle is an inside bar and ATR(1) < .75% of ATR 5 or ATR 20 or ATR 50)
10. RSI (7) <60
Hello,
We have created the scan. Kindly review.
https://chartink.com/screener/2-average-volume-of-20-and-100-days-10-cr
Note: We have disabled some of the conditions from the scan, as it wasn’t showing any results. Can you please elaborate more on the 8th condition.
How can i compare sector with sector to find strong sector
Hello,
We have created the dashboard. Kindly review.
https://chartink.com/dashboard/222792
I want to filter = leatest close greater than ( 52 week high +52 week low ) devided by 2 एंड leatest day मे price minimum 2% ऊपर हो
Hello,
We have created the scan. Kindly review.
https://chartink.com/screener/close-greater-than-52-week-high-52-week-low-devided-by-2
please create scanner –
Hidden or reverse divergence scanner
i)price making higher high on daily timeframe
ii)MACD making lower low on daily timeframe
iii) RSI making lower low on daily timeframe
Hello,
We have created the scan. Kindly review.
https://chartink.com/screener/bearish-divergence-in-duration-of-15-days
Hi Team,
I have been going through all the post since 2021 (Thanks for your good work) and hoping that I would get scanner for me. I have tried to create but it didn’t work.
This formula scans for ascending and descending triangle patterns. The conditions for each type of triangle pattern are as follows:
Ascending Triangle Pattern:
// Ascending Triangle Pattern
((HIGH – LOW) / CLOSE) * 100 >= 5 AND ((HIGH – LOW) / CLOSE) * 100 <= 30 AND (HIGH – CLOSE) <= 0.05 * (HIGH – LOW) AND (CLOSE – LOW) = 5 AND ((HIGH – LOW) / CLOSE) * 100 <= 30 AND (HIGH – CLOSE) <= 0.05 * (HIGH – LOW) AND (HIGH – CLOSE) <= 0.05 * (HIGH – LOW)
The height of the triangle (high – low) as a percentage of the close price is between 5% and 30%.
The distance between the high and the close price is less than or equal to 5% of the height of the triangle.
The distance between the high and the close price is less than or equal to 5% of the height of the triangle.
https://chartink.com/screener/ascending-triangle-pattern-30
Hello Satish,
Based on your provided input, Below i have created a scanner for you, Kindly review –
https://chartink.com/screener/ascending-triangle-on-daily-time-frame
Please be aware that our platform does not offer a feature automatically tracks the previous swing high or low following pattern. To achieve results aligned with this pattern, We utilize the ‘max’ and ‘min’ functions with adjusted percentages. Additionally, it is essential to specify a fixing candle period. While this approach may result in the potential to miss certain stocks, it currently represents the closest approximation we can provide. I hope the logic provided below proves helpful.
Thank you very Sourabh !
Hi team, please create a scanner for intraday MACD crossover (10min time frame)
Hello,
We have created the scan. Kindly review.
https://chartink.com/screener/macd-line-crossed-above-macd-signal-1021
Hi Team,
Can I have a scanner where stock is taking good support getting reversal from Camarilla S3 and reversal from H3 camarilla ?
looking for separate scanners for S3 and H3 reversals
Daily
Weekly
Monthly
If there are existing scanners available for above conditions, please do share the link.
Hello,
Please share the sample chart image for the same on this email ID: [email protected]
Hi Team,
Screenshot sent at 11:17 pm IST,.
Email Subject line: Chartink Reversal Screenshot
Hello Satish, We have responded to your email. Please refer to our email and let us know if you require any modifications.
why yearly closing is not matching with daily close
Hello,
Please share the screenshot for the same on this email ID: [email protected]
Dear Team,
I am looking forward to a scanner with following attributes, if you can kindly help:
Daily 3 WMA crossed above 5 WMA
OR
Daily CCI14 value crossed above 110
Daily MFI 14 value crossed above 68
Daily RSI 14 value crossed above 68
OR
Both condition satisfied.
here is the link of what I made a basic version of it but I am unable to make the either /or conditions for both the attributes
Hello,
We have created the scan. Kindly review.
https://chartink.com/screener/daily-3-wma-crossed-above-5-wma
Hello team,
Please help in creating a screener for
1. An inside bar for the past 2 or 3 days continuously.
2.For the past 10 days there should be at least 2 or 3 days of an inside bar
Hello,
We have created the scan. Kindly review.
https://chartink.com/screener/inside-bar-609659
Note: The above scan will show you the inside bar on the 2 candles. And inside bar at least 3 times in the last 10 days.
Hello team,
Please help me creating a screener
1.Inside bar for past 2,3 and 4 days continuously
2.Two or three Inside bars for past 10 days
Hello,
We have replied to the same requirements that you raised earlier in another comment. Please let us know if you need any modifications.
I have scanner which is required to list stocks in 5 min time frame close above previous day high and it should be green candle with solid body
Hello,
We have created the scan. Kindly review.
https://chartink.com/screener/5-min-time-frame-close-above-previous-day-high-and-it-should-be-green-candle-with-solid-body
Note: For the strong body we have considered the close above open by at least 0.5%.
Can you help me to create a scanner with these conditions
1. narrow cpr where TC,BC and Pivot are one above the other with TC ON top
2. adx in 15 mins time frame (adx – 8, +DI – 13) should be above 25
3. Prive should close above previous day high with solid body
4. super trend (10,3) should be green
5.Volume should be more that 5lakhs
Hello,
We have created the scan. Kindly review.
https://chartink.com/screener/2-adx-in-15-mins-time-frame-adx-8-di-13-should-be-above-25
Note: For the strong body, we have considered the close above open by 3%. Sorry, but your first query is not very clear. Could you please elaborate more on the same and, if possible, share a sample chart image for reference on this email ID: [email protected]
Hello Team,I’m trying to create a screener .but not able to make it
condition
1.Inside bar for past 2/3 days
2.Inside bar range .06 or .07,0.20
please help me with this.
Hello,
We have created the scan. Kindly review.
https://chartink.com/screener/inside-bar-for-past-2-3-days
Note: Please elaborate more on the second requirements. Make sure to share the sample charts image on this email id: [email protected]
In dashboard, Along with stock name, I want alert time to be visible as well, I am not able to achieve it. Could you please assist. Thanks.
Greetings! At this moment, we do not offer the feature you mentioned. Nonetheless, we are actively exploring the option of adding it along with new indicators.
I am unable to provide a specific timeline for the addition of this feature, but I have forwarded your request to our Development team for future consideration.
We value your patience and look forward to enhancing our service for our valuable users.
Note: The alerts can only be set on the scan. Also, any stock that you can see in the column section fulfills your scan conditions in the current time.
How Can one specify exact time for 30 minutes candles – e.g. If i want stock with high volume in previous day’s 3:00 PM to 3:30 Pm, how can we code it in chartink scanner?
Same way is it possible to get stock filtered / scanned based on specific date and time criteria? If yes how?
Hello,
You could use the offset [=-1] to specify the previous day’s 3:00 – 3:30 PM candle. Here is an example scan for the same:
https://chartink.com/screener/last-30-minute-candle-of-the-previous-day-having-max-volume
Could you please elaborate a bit more on what you mean by “scan based on specific date & time”?
previous Potential breakouts scanner is not working from past one week.
*if you have other scanner than please send .
Hello,
Please share the link to the scan where you noticed the issue with an example stock to review the same and respond.
Please note we do not provide any recommendations for scans or stocks here. We only provide a platform where traders can create scans and dashboards based on their strategy and filter out stocks that meet specific criteria.
Hi there,
I am looking for a condition which allows me to track biggest candle of 1hr in last 150 candles. The candle would consume wicks too. Meaning there shouldn’t be any big candle available in last 150 candles.
Hello,
We have created the scan. Kindly review.
https://chartink.com/screener/biggest-candle-of-1hr-in-last-150-candles
hi team chartink,
can I find the scanner for pre mkt time session for Gapup and gapdown stocks
Is there a way to calculate max drawdown?
Hello,
Sorry, but your query is not very clear. Could you please elaborate more on the same and, if possible, share a sample chart image for reference? Make sure to share the image on this email ID: [email protected]
sir ,
1.Can we compare sectors in scan with index.
2.can we add sectors in segment window so that one can scan stocks of that segment only.
Hello,
1) We don’t have the feature to compare the sectors with the index.
2) We have created the dashboard that will tell you the stocks and their respective sectors and the industry. Kindly review.
https://chartink.com/dashboard/239097
Hi Team,
My Query is, i already have few scanners pinned on my chartink dashboard, if i have made any changes or tweeks in any one of the scanners, there is no option to do backtest on that scanner from dashboard to check if my change / tweak has improved my efficiency or reduced it. how to overcome this
Greetings! At this moment, we do not offer the feature to calculate the return, as you mentioned. Nonetheless, we are actively exploring the option of adding it along with new indicators.
I am unable to provide a specific timeline for the addition of this feature, but I have forwarded your request to our Development team for future consideration.
We value your patience and look forward to enhancing our service for our valuable users.
Hi,
I need a scanner where it shows all the stocks that went up 100% in a particular year.
For example, I need the list of 100% stocks that went up in the year 2017-2018.
Is this possible?
TIA
Hello,
Here is an example scan for your reference. Please note that creating a scan for any specific year is impossible. You have to modify the offset manually.
https://chartink.com/screener/current-year-close-greater-than-previous-year-close-by-100
Thank you for this.
I have one question. What is the “number 2” for?
If you multiply any value by the number ‘2’, then it increases by 100%. Similarly for ‘3’ it is 200%.
How to set the condtioin that any stock coming after my screener should not have cleared all the conditions in last 30 days ?
Hello,
We have created the scan. Kindly review.
https://chartink.com/screener/close-crossed-above-sma-20-first-time-in-the-last-30-days
Note: Please refer to the title of the scan for its operations.
how can i scan intraday 10th candle volume > 9th candle volume in 5 min time frame
when I am writing =10 volume > =9th volume then it calculating candle number from one day ago also
Hello,
We have created the scan. Kindly review.
https://chartink.com/screener/10th-volume-candle-is-above-the-9th-volume-candle-5-minute-time-frame
hi,
I can need a screener where we have 3 to 4 days bullish candle with 75% body and after that a tight consolidation on the top of bullish candle’s high with maximum range of 4 to 6%
I have try many times create this screener but i failed.
so please create this screener as soon as possible
Hello,
Sorry, but your query is not very clear. Could you please elaborate more on the same and, if possible, share a sample chart image for reference?
Please share the image to this email ID: [email protected]
hello sir can you create bulsih bottom daily,weekly & monthly time frame
description is 6-7 canndle not break low but close with long rejection or bulish canndle
and Rsi create HH and HL and with EMA crosscover and more techanical tools conformation.
Plz make it.
Hello,
Apologies, but I’m afraid that your message isn’t entirely clear. Could you please provide more details on what you are referring to?
It would be helpful if you could share an example image for reference purposes. This way, we can better understand your request and create a scan that meets your requirements.
You can share the details here: [email protected]
Hello, sorry, but your query is not very clear. Could you please elaborate more on the same and, if possible, share a sample chart image for reference? To this email ID: [email protected]
i can’t ceate bullish bottom in uptrend plz help to solve it.
candition is more than 6 or 7 canddles not break there previous canddle lowes and long wick rejction canddles and multipal conformation like RSI ema adx suptertrend and bollinger bands etc.
Time frame 1hr daily weekly and monthly.
Hello, sorry, but your query is not very clear. Could you please elaborate more on the same and, if possible, share a sample chart image for reference? To this email ID: [email protected]
Hi,
In the screener the monthly means check start from 1 day of month i.e. if I say monthly low then it means low of 1st day to till today. Right ????????
Hello,
Yes, the lowest value between the first day of the month to the current day.
hi,
pls help to configure below scenario which i will run in 9:26 —
stock having today’s first 5 min candle red and it breaks the low of second 5 min candle.
i m planing to buy the premium as the free version wont show the results in 2 or 3 min scans.
Hello,
We have created the scan. Kindly review.
https://chartink.com/screener/first-5-min-candle-red-and-close-crossed-below-the-second-candle-low
Note: Free version data is delayed by 5 minutes. In a premium subscription, charts and scans are updated every minute. Our premium members get realtime data with updates every minute for our Charts & Scans. So if you run a scan at 9:20 am, for example, it would be based on the latest data until 9:19:59am and so on…
Hi,
scanner to see gap down 3% in F&O in first candle in 1 min candle chart as i m going to use this at 9:17 am.
thank u
Hello,
We have created the scan. Kindly review.
https://chartink.com/screener/gap-down-3-in-f-o-in-first-candle-in-1-min-candle-chart
Note: The above scan is for the NIFTY 500 as the ‘FUTURE’ segment did not show any results.
I am trying to create a scanner to list all the stocks which have experienced a volume(daily) spike of more than 0.5% of the total shares/equity/shareholders in the last 20 days. To elaborate, I want to list all the stocks in which the daily volume in the last 20 days on any given day is more than 0.5%.
I have utilized max range of 20, but I am unsure how to incorporate a check for 0.5% of the total shares. Additionally, I am interested in adding an optional check for delivery percentage if possible.
can you please help me or provide some guidance?
Hello,
Do you want the current candle volume above the last 20 day maximum volume by 0.5%?
OR
Do you want the current candle volume above the last 20 day sum of volume by 0.5%?
sorry, but your query is not very clear. Could you please elaborate more on the same and, if possible, share a sample chart image for reference to this email ID:[email protected]
hello sir, thank you for making this website. its very helpful.
can you please make me a screener in which latest 5 min candle breaks the highest point body wise of 2 days ago. Im only able to make it with the wick as condition but not body.
thank you sir
Hello,
We have created the scan. Kindly review.
https://chartink.com/screener/high-and-low-of-body-broken-5-minute-timeframe
how much time needed to understand
Hello,
Apologies, but I’m afraid that your message isn’t entirely clear. Could you please provide more details on what you are referring to? It would be helpful if you could share an example image for reference purposes. This way, we can better understand your request and resolve it.
Hi,
pls help to configure below scenario which is
today’s hammer low equals to n number days ago high or open.
Hello, sorry, but your query is not very clear. Could you please elaborate more on the same and, if possible, share a sample chart image for reference to this email ID: [email protected]?
I am trying to create a scanner to identify stocks that have experienced a bullish crossover of the 50-day and 200-day EMAs within the last 50 days. Can you please help me or provide some guidance?
Hello,
We have created the scan. Kindly review.
https://chartink.com/screener/bullish-crossover-of-the-50-day-and-200-day-emas-within-the-last-50-days
Note: The volume condition is added to avoid indices.
contect number do
INDICATORS SCREEN IS COMING, WHILE PRESSED FOR UPTODATE CHART, I GET ONLY WORKING IS APPEARING ON THE INDICATORS SRENN, PL, CALL 8778401135, PL HELP
Hello,
We provide support only via email, as it makes it simpler for us to understand your requirements & have them documented; hence I suggest you please try to share your requirements here.
Please share your queries to this email ID: [email protected]
Is there a limit on the numbers of scanners that can be saved for a user ? Currently I am not able to save scanners. I already have 30 scanners saved
Hello,
There is not limit. You can save unlimited scans in your account. Please share the screenshot of the error you receive when you try to save additional scan to this email ID: [email protected]
How to know what candle number I am on? I mean suppose it is 9:30 so I am on 3rd 5min candle. Is there a way to find out?
Hello,
You can see this on the Atlas dashboard. We have created a logic for this. Kindly review:
https://chartink.com/dashboard/248936
I want SMA crossover for 90minutes duration. Is it possible to customize the duration of the candle other than the provided durations. I see 1 hour and 2 hour but not 1.5 hour or 90 minute.
Greetings! At this moment, we do not offer the feature of custom time frame, as you mentioned. Nonetheless, we are actively exploring the option of adding it along with new indicators.
I am unable to provide a specific timeline for the addition of this feature, but I have forwarded your request to our Development team for future consideration.
We value your patience and look forward to enhancing our service for our valuable users.
how I set first candle breakout. Actually I want to set first candle breakout with gap up and gap down open.
please reply
Hello,
Sure, we can try to create the scan for the same. Could you please elaborate more on the same and, if possible, share a sample chart image for reference to this email ID: [email protected]
How to see the candle stick Name reflect on Technical chart.
Hello,
Apologies, but I’m afraid that your message isn’t entirely clear. Could you please provide more details on what you are referring to? It would be helpful if you could share an example image for reference purposes to this email ID: [email protected]. This way, we can better understand your request and resolve it.
upper wick is less than 20% of the Body size
How to create this. Kindly help
Hello,
We have created the scan. Kindly review.
https://chartink.com/screener/upper-wick-20-of-the-body-of-the-candle-daily-time-frame
is there chart for viewing stock option intraday
Hello,
Apologies, but I’m afraid that your message isn’t entirely clear. Could you please provide more details on what you are referring to? It would be helpful if you could share an example image for reference purposes to this email ID: [email protected]. This way, we can better understand your request and resolve it.
Are you referring to different types of candles? For example HA candles, OHLC candles.
I wish to have fresh multi year breakouts . which scan should I use
Hello,
Can you please share your requirements along with the sample chart image for the same to this email ID: [email protected]
Sir I want to subscribe your char link . How to subscribe it please guide me for intraday. I have no idea
Hello,
As a premium member, you would be able to:
Access realtime data for Charts & Scans every minute
Create Alerts and receive updates of stock breakouts over SMS/email/mobile/desktop/webhooks
View charts in 1/2/3 minute timeframes with auto-refresh
Run screeners in 1/2/3 minute timeframes with auto-refresh
Scan any watchlist via the segment dropdown of a scan
Private Scans & Dashboard
Customized Atlas dashboards for market overview
Dedicated support for your scanner or dashboard requirements
You can get details/sign up for our premium service here: https://chartink.com/subscription
you are exploring giving relative strength scan from last 5 years ,but you are unable to provide it.Is it so hard to code it? Or there is no development team.
Hello,
please help me write the below scanner for the 2 by 2 strategy using the following condition
1) pick the stocks that have a change of 3 to 6 %
2) in those selected stocks find the list of stocks that has following
a) atleast 3 consecutive bullish ( green candles) needs to be there (chart going up)
b) last two candles(current and previous) needs to be red ( chart starting to fall down)
3) Volume of the last candle should be lowest of the pervious 3 candles.
Note: All the above conditions have been created in the below chart : https://chartink.com/screener/copy-intraday-bearish-setup-2-by-2-setup
Additionally please help me add the following to the above strategy ( this is a strategy where reversal is captured (3 green candles and then fall starts followed by atleast 2 red candles)
logic to add:
4) Make sure to check if the reversal has happened from a previous historical resistance( previously too the graph should have fallen from that zone)
I want to know how to use Abs(value) , Bracket (value)
Hello,
Please find the response below:
Abs – Absolute
Returns the absolute value of an expression/number. For example, using ABS on (5 +(-10) = -5) will return the output as positive (5).
Syntax: Abs(value=-50)
EXAMPLES
Here is an example dashboard view with Abs and without Abs function
body size is 80% of its total candle height
Bracket( )
We do not follow the BODMAS rule in our system. It will always be performed from left to right. In such case you can use the bracket to customise the priority of arithmetic operations.
EXAMPLE
Below is the scan for your reference:
https://chartink.com/screener/current-5min-close-greater-than-50-of-the-previous-days-candle-total-size
I see some of the stocks are missing from ‘CASH’ segment list. E.g, FEDERAL BANK, DYNAMIC Services.
Please look into the latest symbols listed under CASH segment.
E.g.,
“Stock passesall of the below filters in cash segment”
& added filters of price between 190 & 200. It should show FEDERAL BANK in the result but it doesnt.
Dear Team, this is a great tool, i have subscribed membership earlier but didnt continue because of some confusion in filter. Pl clarify my below doubt.
Q 1- While creating a new screener at 2.30 PM of 13 July, if i choose “Daily close>100”. Then in this case what is refers to daily close between below two option:
1) It is closing price at 3.30 PM on 12 July, or 2) it is closing price at 2.25PM on 13 july?
Q 2 While referring latest close, is it last 1 min close or 5 min close or last traded price?
Why i have this confusion?
I have thoroughly read your scanner guide and found one example for gap up filter – your example is “Latest open is greater than 1 day ago close *1.03”
And this is the confusion. It should be “daily close” instead of “1 day ago close”. Because as per NSE data, daily close refers to End of day closing price.
Pls provide me clarity. Thnks
Can you please create a scan for below rule?
On accelerator oscillator indicator value cross from negative to positive in a day chart and vice-a-versa.
Hello,
Can you please share more details on this indicator, like a link and a screenshot highlighting the details of this indicator? You can directly share the details via email to – [email protected]
Hi,
i wish to find stocks using 15min time frame only.
Current 15 min candle breaks previous day low.
Current 15 min candle has RSI divergence with previous day low candle on 15min timeframe
here i wish to compare RSI of current 15min candle and RSI previous day low 15min candle.
Hello,
Please share a sample chart image highlighting the same for our reference so we can help create a scan for you accordingly. You can directly share the details via email to – [email protected]
Hi,
Thanks for making such a amazing tool.
Please help me write down scanner for following conditions.
1. 4% breakout in price (In morning *if possible)
1. The day prior to range expansion day will be narrow range day or negative day.
2. The stock will have 3 to 20 days consolidation prior to range expansion day
3. On breakout day volume is higher than previous day
4. During the 5 days it did not have 4% breakdown.
Hello,
Please share a sample chart image highlighting the same for our reference so we can help create a scan for you accordingly. You can directly share the details via email to – [email protected]
DEAR SIR,
I am registered user of Chartink, but not yet have premium paid user, right now decided to became premium member. Before registering premium member I need support for chart uses i.e. How to paste my developed screener & & save the same.
Kindly reply.
Regards,
Sampat Patil
Hello,
Please confirm that you wish to insert the conditions of the scan to the chart and highlighted the candle which fulfilled your scan conditions.
Unfortunately, At this moment, we do not offer the feature save the chart settings, as you mentioned. Nonetheless, we are actively exploring the option of adding it along with new indicators.
I am unable to provide a specific timeline for the addition of this feature, but I have forwarded your request to our Development team for future consideration.
We value your patience and look forward to enhancing our service for our valuable users.
Hello Sir,
I Want to compare 15Min present candle and previous candle
So Kindly Tell me How to do….
I need to compare 52 week high date (for example 52 week high is 28/12/2023) is less than 52 week low date (for example 52 week low is 03/05/2024) just like we can do in google finance by using function to_date() and it gives the date in dd/mm/yyyy when stock was at its 52 week high or low.
can you add nifty ,50 nifty 500, small cap ,midcap…/. wise group so we can scan in limited stocks
I need opening range breakout in 5 minutes
Hello Athokpam, Based on your provided input, Below i have created a scanner for you, Kindly review it – https://chartink.com/screener/15-min-orb-breakout-v2
Sir
kindly help me to scan stocks based on “momentum” cross above zero value.
Hello Pradeep, Based on your provided input, Below I have created a scanner for you; kindly review –
https://chartink.com/screener/intraday-momentum-index-below-30
Dear Sir,
Thank you very much for your reply and support.
After conducting the back test, I was unable to obtain positive results. Could you please look into this issue? I need the analysis for all stock values.
Best regards,
Pradeep
Hello,
Apologies. Could you please share a sample chart image of the “momentum” indicator that you are referring to so we can ensure the scan matches the same? You can directly share the image via email to [email protected]
Hi Support Team,
I am new to your website. I want to count the previous day 5 minute candles where % change is greater than 2.
Can you please help with the scanner settings.
Thanks
[email protected]
Hello,
Please confirm if you wish to know the number of candles where the % change was above 2. If yes, this is your requirement this won’t be exactly possible. But we can create the dashboard that will show you the correct results if you run the dashboard before 9:20 AM.
Please let us know if you want the same to this email Id: [email protected]
Greetings,
I am trying to create a Bollinger Band Squeeze breakout scan. but unable to do it. can you help.
please send me the below screener—
stocks below 10 years median pe
Hi Akash or any team member of Charink,
Could you kindly assist me here please.
I am a member of Chartink and I am new here., I am in need of a scanner which show me the 1st 15 minute smallest candle formed and arranged in ascending order.
Could you kindly help me on this matter.
Hello,
Apologies but your query is not very clear. Can you please elaborate a bit more on the same and also share a sample chart image highlighting the same for our reference?
You can directly share the image via email to – [email protected]
hello Chartink team,
1. Do we have a function that could specify the considtion “As on Specific Date”
2. Do we have a function to work on a 6-month chart. By this I mean where candles are Jan-Jun and June-Dec…. and this does NOT imply using 6 months ago function as I could be in Augugst and 6 months ago would Feb which is not correct in a 6-month chart….
Hello,
Apologies but we do not have these specific features you mentioned. We will forward your input to our team for consideration in the near future. Thank you for the same.
Is there any way to get sum of volume of last n days, only when price closed positively?
Hello,
Sure, you can do that. Here is an example dashboard where we’ve done this for the intraday timeframe:
https://chartink.com/dashboard/179048
I hope this helps.
Hi,
I want to know about free scanner and premium scanner
suppose I create other than 5 min scanner than result is different or same free and premium scanner and I want to know if i create daily scanner than result will difference or same in premium and free scanner.
Hello,
Free version data is delayed by 5 minutes. In a premium subscription, charts and scans are updated every minute. Our premium members get realtime data with updates every minute for our Charts & Scans. So if you run a scan at 9:20 am, for example, it would be based on the latest data until 9:19:59am and so on…
Hi Team,
Is there any way to set both Length and smoothing length for EMA.
Hello,
Sure, could you please let me know what you are wanting to plot here exactly?
Could you please share a sample chart image for our reference so we could help re-create the same for you? You can directly share the image via email to [email protected]
Hello,
I want to create a scanner with a breakout 5 min candle intraday (close greater than all previous 5 min candles in that particular day) but breakout candle can happen any time (the number of previous candles from first 5 min candle of the day is not known) . e.g. if there are more than once this condition is satisfied in a day, the scanner should give this. How to create this ?
Hello ADI,
Based on your provided input, Below i have created a scanner for you, Kindly review it –
https://chartink.com/screener/price-trading-at-day-high
“I made a payment for a one-month subscription, but the subscription hasn’t been added to my account. It is showing a ‘payment failed’ issue. I have emailed your support team, but I haven’t received any response. How can I resolve this problem?”
Hello Abhijit,
Your payment was successful & your subscription has been activated; you can review your subscription details here – https://chartink.com/subscription_dashboard
Sir, I am not receiving any notifications during trading hours. What I have to do to receive notifications from your side.
Hello, Please share the details below on our official email([email protected]) so we can respond promptly.-
URL of the scan that you are referring to?
Share a few example stocks with us for which you should have received alerts but did not get alerts for the same.
Share a screenshot of the alert settings for your scan. You can do so by opening your scan and clicking on the “modify alert” option, and sharing a screenshot for the same here for our reference.
Hi Team,
I want to create a filter based on smart money concepts. for example break of structure in 4h & liquidity grab in 15m, is it possible to do this?
Hello Eshwar, If you are referring to the indicator ‘Smart money concepts by LUX ALGO’, please note that we have reviewed the logic from TradingView for the mentioned indicator. In the script, there are arrays used to calculate the blocks. It’s currently not possible to do so.
Hi,
I want to run the scan for index “Banknifty” alone, at present if i select banknifty, all the banks in the group are being scanned. how to run index scan for banknifty alone (without nifty) ?
Hello,
We have created the scan. Kindly review.
https://chartink.com/screener/run-the-scan-for-index-banknifty
What does the % Change mean and represent when I run my screen ?
Hi Team,
Wanted to understand better on how to interpret the % Change field in the results after the scan is run
Hello,
The % change is nothing but the difference between current close and the previous candle close in the % form. Please let us know if you need any specific conditions related to the same to this email ID: [email protected]
Thank s for your reply…could you advise how best to interpret it after a trade has been taken earlier based on this being positive…!! Is it a signal to get out of trade…what has been your experience thx
Hello,
The interpretation would simply refer to the close price is either above or below the previous day’s close by the percentage mentioned. You could use it in your scan for example to check if a stock is falling more than 3% or 5% to notify you.
Hi,
my deshtop alert is not working suddenly…
I hav checd all notification settings …all ok
still not getting any alert
plz do advice
HI pls help me
scan line like this
{Average 7-Day Volume}/{Max 3-Month Volume}} > 0.5 —- 1st issue
i think we do not have average function… what else we can use at all other places … this is 2 issues
How to add the latest 15 close candle is always above the vwap ( the scan should always take the latest 15 minute close ) till the end of the market
Hello Anand,
Below i have created an example scanner for last 25 candle where the Close is above VWAP –
https://chartink.com/screener/latest-15-close-candle-is-always-above-the-vwap
I want to screen stock which is running between 50% to 70% from all time high on daily close Basis, weekly close basis and monthly close basis. i want to scan individually and if possible stock which is passing all this 3 criteria
Hello Niteshkumar,
Currently, we do not have a specific feature that tracks all-time highs or lows of stocks. However, we can achieve this by utilizing an alternative method using the MAX and MIN functions, which can scan historical data for a period of up to 2 or 3 years. If this approach meets your requirements, we have provided a example scan below for your reference:
https://chartink.com/screener/weekly-scanner-3-years
How to put detailed filters for BankNifty trading new scanner making: (1) Filter: Latest close, Previous Day High & low, (2) Opening Range High & Low (first 15 – 30 minutes high),( 3) Latest Volume > (2x or 3x) & Average Volume (Last 20 Bars), (4) Close crosses above EMA (5) and Volume > 2 * SMA(Volume, 20) and RSI (14) < 30
Hello Sumit, It would be helpful if you could share an example image for reference purposes. This way, we can better understand your request and create a scan that meets your requirements.
You can share these details here – [email protected]
sir,
past couple of days my alert is not working…
please help
Hello Gopu, this could probably be because of a scan or an alert misconfiguration, which we could investigate and correct, Please share the following details:
URL of the scan that you are referring to?
Share a few example stocks with us for which you should have received alerts but did not get alerts for the same.
Share a screenshot of the alert settings for your scan. You can do so by opening your scan and clicking on the “modify alert” option, and sharing a screenshot for the same here for our reference.
Please share these details here – [email protected]
Dear ChartInk Team
I am new to this website as i come to know recently (2 days ago)
I wanted to have a scanner for the stocks which falls in the below range
on the weekly chart – closing candle of current week should be within the range of previous weeks candle.
Pl. help
Mahadeva R
Hi!
I want to create a scanner that gives me the stocks that have closed below SMA 10 anytime within the past 10 days. I tried using the Max. Min. filter but that didn’t seem to work according to my requirements.
Could someone please guide me as to how I can proceed?
I am not able to change the timeframe for the popup chart
https://chartink.com/dashboard/147735 – This is the scanner URL
“Stock 75min” – Here the popup shows quarterly but I am not able to change to daily chart.
TIA
Hello,
Please note that the chart preview uses the lowest time frame of the conditions used in the dashboard.
sir hindi me video bhejo
Hello Banti, वर्तमान में हमारे पास हिंदी भाषा में कोई ट्यूटोरियल नहीं है, हालाँकि आप हमारे उपयोगकर्ता द्वारा बनाए गए यूट्यूब वीडियो का संदर्भ ले सकते हैं-
https://www.youtube.com/results?search_query=%23chartink+hindi
Hi Team
I want to exclude future stock from my scan. Please guide me.
Hello,
Sure, here is an example scan for the same:
https://chartink.com/screener/all-nifty-500-stocks-excluding-future-segment-stocks
Hello sir,
is latest condition filter removed?
I want to add – latest daily close crossing or closing above the latest daily X -MA . what condition should be used here sir
Hello,
We wanted to inform you that we have changed the name of the “latest” timeframe to “daily” in our scans. This was done to make our scans more concise and easier to understand.
Rest assured that this change will not affect the results of our scans.
Hi
I want to make a scanner for equity in which I want that, if Nifty is 0.25% Negative then my Bearish Scanner triggers, and if Nifty is 0.25% possitive then my Bullish Scanner triggers…. I try to apply this conditions on my current scanners but unable to do it…. Can anyone help me?
Hello Dhaval, Greetings! At this moment, we do not offer the feature you mentioned. Nonetheless, we are actively exploring the option of adding it along with new indicators.
I am unable to provide a specific timeline for the addition of this feature, but I have forwarded your request to our Development team for future consideration.
Dear Team
iam having one scanner of my own which helps me find the corresponding stock as per the condition,but the only problem which iam facing is that the scan give the result only after the 4 th day from movement could this alert for the stock can be found out through premium subscription or can you help me modify my scanner to make it show the alert of the stock on day one itself.
Hello Suhail, Could you please provide more details on what you are referring to? It would be helpful if you could share an example image for reference purposes. This way, we can better understand your request and create a scan that meets your requirements.
Please share these deatils on ‘[email protected]
‘
Hi Sir, I have a query.
Lets say my screener has both 5 min time frame and 15 time frame. In this case i want to understand how the screener works in real time.
Also please let me know if there is a way to contact you and explain some of my other queries.
Hello Srini, Free version data is delayed by 5 minutes. In a premium subscription, charts and scans are updated every minute. Our premium members get realtime data with updates every minute for our Charts & Scans. So if you run a scan at 9:20 am, for example, it would be based on the latest data until 9:19:59am and so on…
Also, We provide support only via email, as it makes it simpler for us to understand your requirements & have them documented; hence I suggest you please try to share your requirements to here ‘[email protected]
‘.
Hi Team,
I can see that VWAP functionality is not working proper in scanner as expected.
I have created screener for filter the stock which are above the hourly,daily weekly and monthly timeframe however in result i can see that stock below vwap in weekly and monthly timeframe also show in my result.
When i have displayed all timeframe value in column its show me same in all timeframe.
Sir, lots of user are uses the vwap functionality and doing trading based on screener result and might get loss because of this issue.
I hope,chartink team will fix this as soon as possible to save the users loss.
If u need i will provide my screen link as well,i want to add my screener condition and result screenshot here however i don’t find attachment option here so cant able to add it here.
Hello Danish, we don’t compute the VWAP values at our end & get this directly from the exchange & even if we did so at our end, there would be slight differences due to the ticks mismatch across various vendors.
The reason is, vendors, consider only a few ticks per second & these tickets could be different across various platforms. We, on the other hand, get the candle computed on the exchange & it includes the ATP/VWAP values as received & computed in the exchange, which is more accurate.
how to create a scanner for If … Then… condition. and can we have multiple cascading of If..Then.. conditions?
how to do that. can you give one example?
Hello,
Here is an example scan for the same. Kindly review the description for more details.
https://chartink.com/screener/if-then-example-scan
I hope this helps.
I have purchased subscription. However im unable to add my stock list (which is in TXT) to the watchlist. Do you have a video tutorial?
Hello,
Could you please share a screenshot of the error/issue you are facing while trying to upload the list? Please ensure the file only contains the Symbol name.
You can directly share the screenshot to our email – [email protected]
I WANT A FILTER LIKE THIS :
THE LOW OF LATEST 5 MIN CANDLE SHOULD BE THE LOWEST LOW FOR THE DAY AT THAT TIME OR THE LOW OF THE LATEST 5 MIN CANDLE SHOULD NOT BE MORE THAN 10% FROM THE DAY’S LOWEST LOW AT THAT TIME.
Hello,
Sure, doing 10% would show alot of stocks. I’ve made this as the current 5 minute low is either the low of the day or within 1%:
https://chartink.com/screener/current-low-either-low-of-the-day-or-within-1
I hope this helps.
Use Magic filter option on Create Scan page … just type your conditions as you types here “in the Weekly chart, was there any weekly volume candle in the last 12 weeks which was green and also above the SMA 21 of Weekly volume candles” and click on generate … Keep experimenting till you reach what you need.
Hello Team,
Firstly I would love to thank you for the great platform you have developed.
I am interested in getting the subscription but before the subscription I want to get my few doubts cleared.
If you are okay, we can have zoom call /google meet as well to clear my questions.
As, I have created this scan but most of stocks are not coming in this scan.
https://chartink.com/screener/multibagger-by-aman
My scan explanation:
I want to filter stocks from
1)100-50000 crore company
2)whose Revenue, EPS and profit all these increased by at least double from last 3 years.
3)the current stock price is less than high of 3 years maximum high.
Just to try filter I removed the 3rd parameter, so that I can filter stocks based on first two parameters. Still I didn’t got stocks in list, which, I know satisfy first two conditions such as BALUFORGE, TEMBO, IRIS, MARINE ELECTRIC, IIFLCaps.
Could you please let me know why these stocks didn’t came in the filtration or if I missed anything.
Thanks
Aman
Hello,
We did receive your email on this and we have reverted back. I hope this helps.
I need to filter stock where last month’s close is higher than all time high till 2 months ago
Hello,
Apologies but we do not have the feature for checking the “All-time high”. We could check if last month’s close is greater than the maximum high 24 or 26 months prior to that. Would that work?
how do i find stocks where greeen candle formation is started (heikinashi )
how do i set a conditional offset. For example if i want to compare the Swing lows and the RSI of respective swing lows candles. ?
Hi. I want a scanner which will tell me the stocks where current 15 minute volume is greater than any previous day 15 candle volume
Hello,
Sure, here is your scan for the same:
https://chartink.com/screener/current-15-minute-volume-is-greater-than-any-previous-day-15-candle-volume
HI SIR
MY NAME IS JITENDRA
NEW CHART IN CHART INK SCANNERS IN VOLUME INDICATOR IS AN KUMAR IS VALUE BELOW ZERO IS BEARISH, ABOVE ZERO IS BULLISH
PLZ SCANNER LINK .
Hello,
Apologies but your query is not very clear here. Could you please share a sample chart image of what you are looking for here for our reference?
You can directly share the image via email to – [email protected]
Please help me to make a daily 10-20 percent profitable strategy screener.
Hello,
Please note that we do not recommend scans or stocks here. We only provide a platform where traders can create scans and dashboards based on their strategy and filter out stocks that meet specific criteria.
If you need help creating a scan, please share your specific requirements to this email ID:[email protected] and we shall create the same for you.
Calculate typical price:
typical = (high + low + close) / 3
2. Compute EMAs:
fast_ema = EMA(typical, 10) // Replace ’10’ with the length you use
slow_ema = EMA(typical, 20) // Replace ’20’ with length * 2
3. Basis (average of EMAs):
basis = (fast_ema + slow_ema) / 2
4. Volatility smoothing:
std_dev = StdDev(typical, 10) // Standard deviation of typical price
smooth_vol = EMA(std_dev, 14) // Replace ’14’ with smoothing length
5. Upper and Lower Bands:
upper = basis + (smooth_vol * 2) // Replace ‘2’ with sensitivity multiplier
lower = basis – (smooth_vol * 2)
6. Long Signal:
Close crosses above lower level, and previous trend is bearish (-1).
7. Short Signal:
Close crosses below upper level, and previous trend is bullish (1).
Hello,
Here are your scans. Kindly review:
Long: https://chartink.com/screener/long-signal-79
Short: https://chartink.com/screener/short-signal-80
To use this custom indicator, you can “Copy scan” scan & make changes. You can view the logic of the custom indicator by clicking on the purple sign(>>) next to the indicator.
Also, you can create your own custom indicator by copying/pasting the logic from the indicator shared here https://chartink.com/indicator
Once you create your custom indicator, it should be visible in the dropdown list under “derived/custom indicators”. Here is a short video on how this can be done.: https://drive.google.com/file/d/1bnr1ahmajyXIpBRE69ese60sm7541-14/view?usp=sharing
I am not able to find editor section in chart link. I want a screener for stocks which are continuously falling from top but are not able to cross 20 ema, 50 ema and 200 ema downward. They are taking support above these 3 ema’s. If possible please share a link for this condition. Thanks
Hello,
Could you please share a few sample chart images highlighting the same so we can review the same and help create a scan for you accordingly?
Please do share the same directly at [email protected]
hello Chartink Team – How di I change timeframe from popup up chart. Current default is 5 minutes
Hello,
There is currently no feature to save your chart settings. However, the charts load based on the browsers cache settings. So the only way is to open a chart in the timeframe of your choice and load it and close the same and all chartink tabs and then open the scan and then load a pop up chart which would be the same timeframe as the previously loaded one.
I hope this helps.
Currently, you can’t change TF from pop up charts. the time frame of the pop up chart is dependent on the widget’s time frame. so whatever is the lowest TF of your widget, that is the time frame of your pop up chart.
request the CI team to confirm the same. TY.
There seems an issue with background color.
Text color is changed to white.
Please look into it
Hello,
Apologies but your query is not very clear. Could you please share a screenshot highlighting the same so we can review and respond accordingly?
You can share the same directly via email to [email protected]
Currently, you can’t change TF from pop up charts. the time frame of the pop up chart is dependent on the widget’s time frame. so whatever is the lowest TF of your widget, that is the time frame of your pop up chart.
request the CI team to confirm the same. TY.
Hello,
This is partially true. The time frame of the pop-up chart is based on the lowest time frame of the widget. But you can change it via setting up the favourite chart template. Can you please raise this query to this email:[email protected], and our support team will resolve this issue?
I want to scan that stocks which
Difference between Last 60 days closing Average
and
today’s closing price
is not more than 5 % and not less than 5 %
Hello,
We have created the scans. Kindly review.
https://chartink.com/screener/the-difference-between-the-close-and-the-sma-60-is-within-5
https://chartink.com/screener/the-difference-between-the-close-and-the-sma-60-is-more-than-5
Note: Both of them cannot be true at the same time. So, we have created two different scans.
run screener show stock per curser show indicator.
Hello,
Apologies, but I’m afraid that your message isn’t entirely clear. Could you please provide more details on what you are referring to? It would be helpful if you could share an example image for reference purposes. This way, we can better understand your request and resolve it.
Make sure to send the screenshot to this email ID: [email protected]
Dear Team Chartink,
Currently we have function ‘ SUM (total for given period)’, Now , Is it possible If I want to sum only positive or negative days from given period. ie, sum (close-one day ago close > zero),n days and
sum (close-one day ago close < zero),n days .
Thanks
Harish
Hello,
Sure, here is an example dashboard for the same:
https://chartink.com/dashboard/317234
Please help me to create a scanner with following:
first 5 minute candle , with open is equal to low and upper wick is less than 0.2%
and first 5 minute candle , with close is equal to high and lower wick is less than 0.2%
Hello,
We have created the scans. Kindly review.
https://chartink.com/screener/first-5-minute-candle-with-open-is-equal-to-low-and-upper-wick-is-less-than-0-2
https://chartink.com/screener/first-5-minute-candle-with-close-is-equal-to-high-and-lower-wick-is-less-than-0-2
hi, I want to make a scanner in which I want that, Monthly RSI and weekly RSI more than 70 and daily RSI between 40 and 50, with macd crossover and positive double volume breakout…. I try to apply this conditions on my current scanners but unable to do it…. Can anyone help me?
Hello,
We have created the scan. Kindly review.
https://chartink.com/screener/monthly-rsi-and-weekly-rsi-more-than-70-and-daily-rsi-between-40-and-50
Note: We have disabled the daily conditons, as they weren’t showing any results. For the volume, we have used the daily volume above the average volume of the last 20 days.
How to creat a bullish scan using buy order vwap and sell order vwap
Hello,
We have created the scan. Kindly review.
https://chartink.com/screener/buy-order-vwap-above-sell-order-vwap-change-above-zero
Note: Please refer to the title of the scan for its operations.
how can i check for volume in future stocks.
Hello
I notice a field name ‘Marketcapname’ as a selection for filter. Please let me know how I filter using this field and what are the associated possible values?
Thanks – vaidya
Hello,
We have created the scan. Kindly review.
https://chartink.com/screener/large-cap-stocks-85936
Note: You can follow the same syntax and create the scan for the mid and small cap, too.
Clear, insightful, and perfectly structured
Hello,
Apologies, but I’m afraid that your message isn’t entirely clear. Could you please provide more details on what you are referring to? It would be helpful if you could share an example image for reference purposes. This way, we can better understand your request and resolve it.
Please make sure to share the details on this email ID: [email protected]
Is it possible to get the value area high and value area low levels from volume profile charts? If yes, can you help in creating a scanner
Greetings! At this moment, we do not offer the feature of the volume profile, as you mentioned. Nonetheless, we are actively exploring the option of adding it along with new indicators.
I am unable to provide a specific timeline for the addition of this feature, but I have forwarded your request to our Development team for future consideration.
We value your patience and look forward to enhancing our service for our valuable users.
i AM DOING THIS MANUALLY SO I NEED A SCANNER WHO CAN HELLP ME DO IT SIMPLY, I NEED LIST OF STOCK WHO CHANGE IS 4-12 % MONTHLY FOR PAST 10 YEARS, LIKE BELOW EXAMPLE,
EXAMPLE :-sTOCK xyx
April 24: 1ST – 20th CHANGE IN VALUE 10%
April 23: 1st – 20th change in value 7%
April 22: 1st – 20th change in value 8%
for past 10 years, can this by possible
Hello,
Apologies, but I’m afraid that your message isn’t entirely clear. Could you please provide more details on what you are referring to? It would be helpful if you could share an example image for reference purposes. This way, we can better understand your request and create a dashboard that meets your requirements.
Please share the dashboard to this email ID: [email protected]
We can manually create the % change for the last 12 months. Please let us know if you want the same in the above support email ID.
yes i need this
Hello,
We have created the dashboard. Kindly review.
https://chartink.com/dashboard/323011
Note: Since no stock showed the % change range of 4 to 12 because of the recent market crash, we have disabled those conditions.
Can we get at date and timestamp coloumn , to know exactly when the stock was visible on scan
Hello,
I’m assuming you are referring to the backtest results of a scan. Please note, the backtest results would reflect backtest bars based on the smallest timeframe used in your scan. If the smallest timeframe used is the “daily” timeframe, all the backtest bars would show for each day.
Similarly if you user a 5 minute intraday timeframe in your scan, the backtest would reflect for each 5 minute bar spread across the whole day.
I hope this helps.
Please guide about how can I exclude a particular sector/industry from my list. For example, I dont want to see Banking and Media Sector.
Hello,
We have created the scan. Kindly review.
https://chartink.com/screener/excluding-banking-and-media-stocks
Dashboard with sector and industry name: https://chartink.com/dashboard/147605
sir is that possible that if i made some scan and there are already 4 stocks showing in that scanner ,but when new stock match that criteria and came in to list which will highlighted in some other way that we can notice that this one new stock…
Hello,
Yes, it is possible with the alerts. After you set up the alerts, the latest alerts are in the bold letters and the stocks which fulfilled the conditions on previous as well as on the current candle are in fainted letters.
You can ask us about the same in this email. So, we can share the screenshot with you. [email protected]
GOOD
Hello,
Thank you for the update. Please let us know if you have any doubts related to our site to this email ID: [email protected]
Hello,
Please create scanner for below mentioned criteria
HA( Heikin Ashi )current price is above EMA(5,8,13) and
EMA(5,8,13) is above EMA(21)
last 2 days HA close is bullish (Bullish trend-Green body)
and current HA close price within body of previous day HA (some pullback-Red HA )
MACD (5 ,21) is crossed MACD signal line 3 and
Hello,
This can be done with the help of a custom indicator/formula. Here is an example scan for your reference:
https://chartink.com/screener/ha-heikin-ashi-current-price-is-above-ema-5-8-13-and
To use this custom indicator, you can “Copy scan” scan & make changes. You can view the logic of the custom indicator by clicking on the purple sign(>>) next to the indicator.
Also, you can create your own custom indicator by copying/pasting the logic from the indicator shared here https://chartink.com/indicator
Once you create your custom indicator, it should be visible in the dropdown list under “derived/custom indicators”. Here is a short video on how this can be done.: https://drive.google.com/file/d/1bnr1ahmajyXIpBRE69ese60sm7541-14/view?usp=sharing
Hi ,
how to create Full two days candle or three days candle , i have check not like 2 day ago , 3 day ago ,
Hello,
This may be partially possible. Can you please elaborate more on what you are trying to achieve here? Please share the details to this email ID: [email protected]
SIR how to write “5 minute close greater than equal to >> s4 new” query in chartink please reply me
Hello,
This can be done with the help of a custom indicator/formula. Here is an example scan for your reference:
https://chartink.com/screener/5-minute-close-crossed-above-pivot-s4
Note: If you are not looking for the crossed above, then you can disable the last condition.
To use this custom indicator, you can “Copy scan” scan & make changes. You can view the logic of the custom indicator by clicking on the purple sign(>>) next to the indicator.
Also, you can create your own custom indicator by copying/pasting the logic from the indicator shared here https://chartink.com/indicator
Once you create your custom indicator, it should be visible in the dropdown list under “derived/custom indicators”. Here is a short video on how this can be done.: https://drive.google.com/file/d/1bnr1ahmajyXIpBRE69ese60sm7541-14/view?usp=sharing
[email protected]
I purchased one month chartink subscription today, 3-May-2025. The current scan results give below columns only.
Sr. Stock Name Symbol Links % Chg Price Volume
I want to have more columns in the backtest 9 months data download CSV result file. e.g. want to have additional columns like MACD line value, RSI value etc. It appears in Atlas for single day, but how do i download 9 months backtest data with these additional columns?
Greetings! At this moment, we do not offer the feature for the custom result section, as you mentioned. Nonetheless, we are actively exploring the option of adding it along with new indicators.
I am unable to provide a specific timeline for the addition of this feature, but I have forwarded your request to our Development team for future consideration.
We value your patience and look forward to enhancing our service for our valuable users.
Hello Akash sir,
I purchased one month chartink subscription on 3th june 2025.Can get more clarity on Min and Max filter with example.
Also can you make a filter that stcoks when break the monthly expiery that is last month on thursday low it show with 15min time frame.Also when it cross above thurasday high.but when it also show me when it break after 2 days or may be 15 days and cycle do day by day automaticaly.I never want to change it all days.
Days change automatially.one for bearish sign and one for bullish sign.
I will update with exmaple that recently Chambalfartilizer stock low is 578 on 29th may 2025(thurasday)next day when it 15min candle close the last expiery day low it show me in filter and simultaneously.
plz update me as soon as possible.Thanks in advnace.
Hello,
1) The max retrieves the maximum value of a given attribute (open, high etc..) throughout “n” candles/periods. It can even work on like addition, subtraction and so on.. e.g. “max(20, high + low + close / 3)
Example scans: 1. https://chartink.com/screener/current-volume-is-maximum-volume-in-a-previously-50-days-volumes
2. https://chartink.com/screener/current-close-price-above-the-previous-20-candles-high
The min returns the minimum value from a specific duration. For example, for finding the minimum volume in the last 10 candles, we would use “Latest Min ( 10 , Latest Volume ) “.
Example scans: 1. https://chartink.com/screener/latest-close-is-less-than-the-minimum-close-in-the-last-10-days
2. https://chartink.com/screener/stocks-making-52-week-low-1
2) We currently support only NSE cash stocks and indices; we have created a segment group named ‘futures’ to scan stocks traded in the F&O group. If you select futures, scanning will be done based on cash stock prices/ values. We don’t support ‘future’ segment.
HOW TO USE CHARTINK
Hello, sure, please find our tutorials,
Scans: https://chartink.com/articles/scanner/scanner-user-guide/
Alerts: https://chartink.com/articles/alerts/alerts-guide/
Desktop notifications: https://chartink.com/articles/alerts/desktop-mobile-a-k-a-web-notifications/
Web-hooks: https://chartink.com/articles/alerts/webhook-support-for-alerts/
If you need help creating a scan, please share your requirements, and we shall create the same for you.
HELLO SIR, I WANT FIND STOCK WHOSE 3 EMA CROSSED 21 EMA IN ANY LAST FIVE CANDLE IN FIVE MINTS TIME FRAME. AND WHOSE CURRENT CANDLE CROSSED RSI 70
( please provide scanner in above condition…)
Hello,
Sure, here is your scan for the same:
https://chartink.com/screener/scan-for-ema-3-crossing-21-in-the-last-5-candles-with-rsi-5-min-tf
HELLO SIR, I WANT FIND STOCK WHOSE 3 EMA CROSSED 21 EMA IN ANY LAST FIVE CANDLE IN FIVE MINTS TIME FRAME. AND WHOSE CURRENT CANDLE CROSSED RSI 70
please provide scanner in above condition.
Hello,
Sure, here is your scan for the same:
https://chartink.com/screener/scan-for-ema-3-crossing-21-in-the-last-5-candles-with-rsi-5-min-tf
i want to scan stock as per my parameter, and it convert to excel.
Hello,
Apologies but your query is not very clear for the 2nd part. Do you mean you want the scan results to be shown in an excel sheet? Kindly clarify.
How can I filter IPO stocks which are listed in 2025 or last 1 year as non of the scanner provided above of IPOs are not filtering stocks.
appreciate a quick help.
Hello,
Sure, you could refer to this scan:
https://chartink.com/screener/ipo-stocks-this-year-until-july-2025
I hope this helps.
How can we apply filters like Monthly RSI(14) till previous day, to avoid repainting?
Dear Sir/Mam,
Pls suggest how i can create filter that
RSI, 14 (-1) > SMA, 14 ((RSI, 14), -1)
RSI value= 14
SMA =14 of RSI,14
Hello,
We have created the scan. Kindly review.
https://chartink.com/screener/rsi-14-greater-than-sma-14-of-rsi-14
Past EPS for Stocks undergoing SPLIT is not adjusted by dividing past EPS with split number (for COMPARISON with recent EPS)
EPS for Reliance Industries Limited
Latest Quarter (Q1-2025) EPS is 19.95
Same Quarter Preceding Year (Q1-2024) EPS is shown as 22.38 on Chartink.
If this is adjusted for split (1:2) in Reliance stock then
EPS for Same Quarter Preceding Year (Q1-2024) EPS will be 11.19
Tradingview, screener.in, finology ticker, etc. all screeners make this adjustment, so that past EPS data can be readily compared with latest EPS data after split in any stock.
Could you please make necessary changes in EPS datato reflect split for all stocks that have undergone split in past. This would make the data more comparable and insightful.
Hello,
Thank you for bringing this to our attention, and apologies for the inconvenience. We will fix this issue over the weekend.
SWING MULTI-TIME FRAME MOMENTUM ANALYSIS
HOURLY RSI (14)>70
DAILY RSI (14)>50
DUAL SUPER TREND SYSTEM:
SHORT SUPERTREND-7,3
LONG SUPERTREND-14,3.5
CANDLE WILL BE CLOSED OVER BOTH THE SUPER-TREND.
CAN YOU MAKE THIS SCAN FOR ME? Thank You.
Hello,
Please refrain from raising multiple comments related to the same query.
Multi-time frame momentum trading strategy
One hour RSI>70
Daily RSI>50
SHORT SUPERTREND-7,3
LONG SUPERTREND-14,3.5
CANDLE WILL BE CLOSED OVER BOTH (LONG AND STRONG) SUPER TREND.
CAN YOU MAKE THIS SCAN FOR ME. THANK YOU
Hello,
We have created the scan. Kindly review.
https://chartink.com/screener/one-hour-rsi-70-daily-rsi-50
how can I get the industry name of which my stock belongs to !!
Hello,
We have created the dashboard. Kindly review.
https://chartink.com/dashboard/360191
Hi,
if I have created a scan and I want to move those stocks to another scan, is there a simple way of doing this.
what i am looking for is a top down approach, stocks, scanned as bullish bearish.. move to another scan for fulfilling my other criteria on the previously scanned stocks and filter further. I want to move stocks from one bucket to another to refine results further.
Hello, We can save the scan results into a watchlist in Atlas dashboards and have the watchlist run on another widget/ scan. For the watchlist to update during market hours, you will need to keep the Atlas dashboard page open; enabling the below option would create a new watchlist named “Dynamic-xxx,” which you can re-use for other widgets or scans; this is often used when you’d want to get the list of top 10 s stocks and then run other scans based on only the top 10 stocks
Here’s a video tutorial on the same: https://drive.google.com/file/d/1wpuIKG4Ggxn8XnR56_m_JgtLVzJDo_mU/view
Hi
please let me know how i can find delivery volume of stock
Hello,
Unfortunately, we don’t have the feature for the deliver volume.
Hello Team ,
I wanted to create a screener saying that –
“Current PE > max PE ( last 2 years ) ,
Current TTM Net profit > 0
Sales growth over last 2 years is > 20% ”
Also another Scenner
“Current PE 0 and
sales growth over last 2 years is > 20% “
Hello,
This can be done with the help of a custom indicator/formula. Here is an example scans for your reference:
https://chartink.com/screener/current-pe-max-pe-last-2-years
https://chartink.com/screener/sales-growth-over-last-2-years-is-20
To use this custom indicator, you can “Copy scan” scan & make changes. You can view the logic of the custom indicator by clicking on the purple sign(>>) next to the indicator.
Also, you can create your own custom indicator by copying/pasting the logic from the indicator shared here https://chartink.com/indicator
Once you create your custom indicator, it should be visible in the dropdown list under “derived/custom indicators”. Here is a short video on how this can be done.: https://drive.google.com/file/d/1bnr1ahmajyXIpBRE69ese60sm7541-14/view?usp=sharing
Hi,
Is it possible to scan only specific stocks in Futures segment? For e.g. I want to scan for AXISBANK, HDFCBANK, RELIANCE. What filter can I use?
Thx
Hello,
We currently support only NSE cash stocks and indices; we have created a segment group named ‘futures’ to scan stocks traded in the F&O group. If you select futures, scanning will be done based on cash stock prices/ values.
hi team . i want to generate scanner for intraday.
condition are as follow.
first 1,3,5 min candle close above or below previous day high or low respectively.
and volume of these candle are greater than the volume of previous 20 day first candles on respective time frame
Hello,
We have created the scan. Kindly review.
https://chartink.com/screener/5-min-time-frame-candles-close-above-previous-day-high
Note: The only way to select the first 5-minute candle volume for the last 20 day is to add them manually. So, for the previous day’s first 5-minute candle you add [=-75], for the 2 day ago first 5-minute candle you add [=-150] and so on for the last 20 day. We have added for the first 3 days, you can follow the same syntax and add for other day’s as well.
hey Chartink team
i want this below formula to be in my dashboard in the form of a chart showing percentage of stocks qualify this criteria every day
also i want to add in this chg of the day should be minimum 2% +
latest High – greatest( latest Open, latest Close ) < Abs ( latest Open – latest Close ) * 0.2
Hello,
We have created the dashboard. Kindly review.
https://chartink.com/dashboard/368282
Note: We don’t have the feature to ensure that the % is above 2
sir remove chart display in my screen.
Hello,
Here, we assume you are referring to the chart preview that you get when you hover over the stock symbols. If yes, please raise the same query to this email ID: [email protected]
Since we cannot share the image here.
Hello Chartink Team,
I would like to request a custom scanner for the entire NSE cash market based on Demand Zone identification. The requirements are:
Lookback period: Last 6 months.
Demand Zone Structure:
Must have all 3 components: Legin + Base + Legout.
Legin: Can be either a green or a red candle.
Base: Small candles (body less than 50% of the range, showing balance between buyers and sellers).
Legout: A big, strong green exciting candle (bullish candle where body > 60% of range) with high volume.
Fresh Zone Only: The demand zone must be fresh (tested for the first time in the last 6 months).
Flexibility in Timeframe: I should be able to choose/change the timeframe (Daily, Weekly, etc.) as per my requirement.
One-Click Scan: I want a scanner that can generate signals with a single click whenever such demand zones are formed.
Could you please help me build such a screener or guide me on how to implement these conditions inside Chartink?
Hello,
Apologies, but I’m afraid that your message isn’t entirely clear. Could you please provide more details on what you are referring to? It would be helpful if you could share an example image for reference purposes to this email ID: [email protected] This way, we can better understand your request and create a scan that meets your requirements.
I need an Screener formula like
Current 5 min Close crossed above First candle of day 5 Min open value + ((Previous 5 days(High-low) range)*0.382).
((5-day SMA of Daily (High-Low)) * 0.382) + First candle of day 5 Min Open /Day’s Open
Hello,
Please refrain from raising multiple comments related to the same issue.
1.Calculate a 5-day Simple Moving Average of the daily candle’s range (High minus Low). lieke get previous 5 days daily (H-L) get an avaerage of it.
2.Then multiply this SMA value by 0.382.
3. last part, day open, is the opening price of the current day. You add this to the previous calculation.
Sample: (0.382 * previous 5days daily SMA((High-Low), 5) )+ day open
Logic:
Now current 5min candle close crossed above value ( (0.382 * previous 5days daily SMA((High-Low), 5) )+ day open)
Need an chartink formula
Hello,
We have created the scan. Kindly review.
https://chartink.com/screener/current-5min-crossed-above-value-0-382-previous-5days-daily-sma-high-low-5-day-open
i make watch list,but in segment ,its cant shows
Hello,
Please raise the same query to this email ID: [email protected]
Since we cannot share the image here.
Hi Team,
Is it possible to create scanner in here based on that we can filter out such stocks which does not break it 1st 1 min candle high or low and either they are trading previous week high or low
Other think Is it possible to send live result data from the scanner result to Goggle sheet and it can refresh auto there , Mostly I am looking something like integration with chartink and google sheet. So that Google sheet pull data real time from chartink scanner
Please let me know if that possible , I am looking forward to register for Premium subscription if that possible.
Hello,
1. We have created the scan. Kindly review.
https://chartink.com/screener/stocks-which-does-not-break-it-1st-1-min-candle-high-or-low
2. Webhooks can send data within a Google sheet; please try to view a few docs to have this integrated. I came across the following tutorials that may be helpful
https://developers.pandadoc.com/docs/webhook-verification-with-google-sheets
https://blog.runscope.com/posts/tutorial-capturing-webhooks-with-google-sheets
Here is a video tutorial on the same for your reference – https://www.youtube.com/watch?v=hj3y0QTykdQ&list=PPSV
Hope this helps
Hi Chartink Team,
Thank you are doing wonderful job,
Can you help me put the my screening logic or can you provide the screener
my logic is stock 50% fall from the top after correction price makes high 30% from the low
or
price recover 30% high from any last 6 month low
Hello,
Thank you for your appreciation. Apologies, but I’m afraid that your message isn’t entirely clear. Could you please provide more details on what you are referring to? It would be helpful if you could share an example image for reference purposes to this email ID: [email protected] This way, we can better understand your request and create the scan for the same.
Hi Team
I wanted to create a chart if the first 15 min candle breaks previous day high and entry to the stock from 2nd candle (i.e 9:30 am or as soon first 15 min candle breaks)and also auto exit from the market if it gains 5 points in any candle within 3 pm or if market goes down if it cross day low execute SL.
Thanks
Chethan
Hello,
We have created the scan. Kindly review.
https://chartink.com/screener/the-first-15-min-candle-breaks-previous-day-high
Note: The entry and the exit are up to you. We won’t be able to provide the same. But the scan will show you the results as per your requirements.
dbdndn
Hello,
Apologies, but I’m afraid that your message isn’t entirely clear. Could you please provide more details on what you are referring to? It would be helpful if you could share an example image for reference purposes to this email ID: [email protected] This way, we can better understand your request and resolve it.
How to code this: ‘Highest High Today (from the start of the today session i.e. first candle of the day) till 1 candle before the current candle in 15 min time frame < current candle close in 15 min'
Hello,
Please confirm that you want the current 15-minute close to be above the high from the previous candle to the first candle. If yes, this is possible with the sub-groups.
If no, kindly elaborate more on the same.
confirm that you want the current 15-minute close to be above the high from the previous candle to the first candle. = YES
Hello,
Sure, here is a scan for the same:
https://chartink.com/screener/current-close-greater-than-all-previous-candle-s-high-until-1st-candle
hi team, thank you so much for updating to dark theme. i want to use the ipo day high, low, open and close. do we have pre built attribute for this? i have checked i haven’t found any.
Hello,
At this moment, we do not offer the feature to extract the IPO values, as you mentioned. Nonetheless, we are actively exploring the option of adding it along with new indicators.
I am unable to provide a specific timeline for the addition of this feature, but I have forwarded your request to our Development team for future consideration.
We value your patience and look forward to enhancing our service for our valuable users.
Hi Team. First of all great work. I’m moving from scanner to scanner for my requirements. From Tradingview to Zerodha Streak and now to Chartink. You have provided lot of flexibility and I’m getting results closer to my expectations.
There is one hurdle i’m facing, where I feel i need to apply if-else condition. Please help be with the below query:
I want to count the number of candles in the last 1 hour when 5-minute volume is greater > 10000, but consider only green candles. That is, when 5-min candle is green and volume of that candle > 10000, count such instances in the last 1 hour. Since there is no if-else hence I’m struggling to include the green candle filter.
Hello,
You’re welcome and thank you for your appreciation. We have created the dashboard. Kindly review.
https://chartink.com/dashboard/382402
Note: It is not possible to calculate the same in the last hour based on the clock, i.e. 11:00 to 12:00. However, it is based on the last 12 candles of the 5 minutes, i.e. in total last hour.
How to delete alerts?
Hello,
Below is the link for the same. Kindly review.
https://chartink.com/alert_dashboard
Note: Please scroll down horizontally to see the buttons for deleting the alerts.
Namaskar Dear,
Your screener is really good . I am a Investor for Long term.
However I am not able to find one type of Moving avg in your screener i.e. Variable Moving Average.
Kindly add the indicator Variable Moving Average in your database.
Hello,
Thank you for your appreciation. Please share the link/logic/pine script to the indicator along with the sample chart image for the same to this email ID: [email protected]
Nice post. The way you explained the scanner concepts made it easy to follow. I picked up some useful insights. Please keep sharing more such content.
Kindly add the indicator- Variable Moving Average
Hello,
Thank you for your appreciation. Please share the link/logic/pine script to the indicator along with the sample chart image for the same to this email ID: [email protected]
// Today CPR (Central Pivot Range) is narrow
(Today_CPR_Range Yesterday_CPR_High) AND
// Previous day’s closing candle is near that day’s high (e.g., close within 1% of high)
((Previous_Day_Close >= Previous_Day_High * 0.99) AND (Previous_Day_Close Previous_Day_High)
this is my query …please help how to run this query to run in your platform
Hello, this can be done with the help of a custom indicator/formula. Here is an example scan for your reference:
https://chartink.com/screener/narrow-cpr-and-1-day-ago-close-is-within-1-of-1-day-high
To use this custom indicator, you can “Copy scan” scan & make changes. You can view the logic of the custom indicator by clicking on the purple sign(>>) next to the indicator.
Also, you can create your own custom indicator by copying/pasting the logic from the indicator shared here https://chartink.com/indicator
Once you create your custom indicator, it should be visible in the dropdown list under “derived/custom indicators”. Here is a short video on how this can be done.: https://drive.google.com/file/d/1bnr1ahmajyXIpBRE69ese60sm7541-14/view?usp=sharing
Hi Team,
In creating filters, My ask is I have to find the last few number of candles. This number is based on the candles shape and color.
For example –
1. the current candle(index – 0) should be Green (Open > Close)
2. the previous candle or sets of candles should be Red (Open Close)
–> This is the tricky part in check 2 —
Check 2A – There should be only 1 Red Candle (at index -1) if the High and Low is greater than High and Low of Green Candle (at index -2)
OR
Check 2B – There can be more than 1 (max 4) Red Candles (at index -1, -2, -3, -4) if the High and Low is falling inside the High and Low of Green Candle at the relevant respective position (at index -2 or -3 or -4 or -5)
The number of Red Candles with this above condition can be any between 1 and 4. I have to check this dynamically.
In Summary –
I need all the stocks which has latest green candle and previous to this there can be either 1 Red candle satisfying “Check 2A” or more than 1 Red candle with “Check 2B”
Please let me know How to create these Filters.
Thanks,
Guru.
Hello,
We have created the scan. Kindly review.
https://chartink.com/screener/the-current-candle-index-0-should-be-green-open-close
Note: Sorry, but your ‘2B’ query is not very clear. Could you please elaborate more on the same and, if possible, share a sample chart image for reference to this email ID: [email protected].
I want to get the list of stocks which are not having derivative purely equity stock. how can i write the query.?
Hello,
We have created the scan. Kindly review.
https://chartink.com/screener/list-of-stocks-which-are-not-having-derivative-purely-equity-stock
Can you add Pivot and CPR indicators?
Hello,
This can be done with the help of a custom indicator/formula. Here is an example scan for your reference: https://chartink.com/screener/narrow-cpr-2222223625
Note: You will find the ‘pivot’ indicator in our default indicator section, when you click on the ‘plus’ sign.
To use this custom indicator, you can “Copy scan” scan & make changes. You can view the logic of the custom indicator by clicking on the purple sign(>>) next to the indicator.
Also, you can create your own custom indicator by copying/pasting the logic from the indicator shared here https://chartink.com/indicator
Once you create your custom indicator, it should be visible in the dropdown list under “derived/custom indicators”. Here is a short video on how this can be done.: https://drive.google.com/file/d/1bnr1ahmajyXIpBRE69ese60sm7541-14/view?usp=sharing
I want to use Supert Trend Scan on Weekly & Monthly chart. Please guide.
hi team,
can you please help with below query.
1) i want to scan only nifty 50 / nifty mid cap / nifty 100
2) market capital greatet than 500 cr
how to add above filters, please suggest
thanks
We are missing stocks in the scan simply because they are in BSE or SME series. i saw a number of requests before in the queries for this feature and though the reply generally mentions about this feature coming soon, nothing concrete has happened so far. Do you have an approximate timeline when this support for BSE and NSE – SME stocks is expected to be included in the scans ?
Hello Sai, we are in the process of including support for BSE and SME series stocks. At this time, we are unable to provide an estimated time of arrival, but we will share this information as soon as it is available.
Well explained post. I found the content clear and practical, and it helped me understand scanners better. Waiting for your future posts.
Hello,
Thank you for the appreciation. Please let us know if you want any specific guides.
I wanted to scan the day’s first 5-min candle whether has the highest volume than the first 5-min candle of the last 4 days (300 bars of 5 min). I made this scanner but it is not picking up the right stock when i check manually. It is checking all past 300 bars (5-min) volume. But I want only the first 5-min bars to be checked amonng those 300 bars. Please look at the conditions. Wht mistake did I make..?
[=1] 5 minute Volume > [-1] 5 minute Max ( 300 , [=1] 5 minute Volume )
Hello,
We have created the scan. Kindly review.
https://chartink.com/screener/1-5-minute-volume-1-5-minute-max-300-1-5-minute-volume
Note: For the previous day’s last candle the offset is [=-1]. You were using the [-1] offset, which is previous candle.
Hi Team,
I want add one condition in the scanner that first 15 mints candle length (high – Low) should be less then or equal 2.5%
can you please help me to add this condition in the scanner
Hello,
We have created the scan. Kindly review.
https://chartink.com/screener/first-15-mints-candle-length-high-low-should-be-less-then-or-equal-2-5
Note: We have used the reference of the close for the 2.5%.
Hi Team,
I am prime member.
I need two conditions in the scanner
1. first 15 mints candle length (high – low) should be less then 2.5%.
2. first 15 mints high side wick should be les then 50% of the body length.
Than you,
Kalyan
Hello,
We have created the scan. Kindly review.
https://chartink.com/screener/first-15-mints-high-side-wick-should-be-les-then-50-of-the-body-length
Need a prompt for scanner :
61% retracement of previous swing log in Hourly closing
61% retracement of previous swing log in Daily closing
Hello, sorry, but your query is not very clear. Could you please elaborate more on the same and, if possible, share a sample chart image for reference to this email ID: [email protected]?
Weekly Open = Low and Weekly Open = High Scanner
Hello,
We are reviewing the incorrect charts on our platform. We will fix this as soon as possible. Apologies for the inconvenience, and thank you for your patience.
WHY I AM GETTING SYNTAX ERROR FOR BELOW LINE
Yearly count( 10, 1 where ( yearly high – yearly low ) = 5
Hello,
Can you please let us know what you are trying to achieve here? Kindly share your requirements to this email ID: [email protected]
I want create won screener for trades. Please help me.
Hello,
Sure, we can try to create the scan. Could you please elaborate more on the same and, if possible, share a sample chart image for reference to this email ID: [email protected]?
sir mere subscription nahi हुआ है मेरे रुपए भी कट गए
Hello,
Your payment was successful & your subscription has been activated.
You can review your subscription details here – https://chartink.com/subscription_dashboard
I want create a screener for the following prompt, kindly create a code for me so that i can make screener.
2nd Candle Open And Close withing 1st Candle open & close and 3rd Candle Open And Close withing 2nd Candle open & close
Hello,
Sorry, but your query is not very clear. Could you please elaborate more on the same and, if possible, share a sample chart image for reference to this email ID: [email protected]
i am unable to save the query scan .. getting error 500
Hello,
Please share your requirements to this email ID: [email protected] along with the sample chart image for the same.
I WOULD LIKE SUBSCRIBE YOUR PACKAGE ANNUALY
NEEDS HELP ON HOW TO UTILISE
Hello,
We offer a 5% discount on quarterly, 10% discount on yearly and a 15% discount on a 2-year subscription. You may renew here: https://chartink.com/renew
Here are the effective subscription charges after the discounts:
Monthly(No discount available) – 780 Rs
Quarterly(after 5% discount) – 2220 Rs
Yearly(after 10% discount) – 8500 Rs
2 Years(after 15% discount) – 16,000 Rs
I hope this clarifies any doubts you may have regarding the subscription charges.
I want a scanner with these characteristics.
1.The daily closing price of the stock must be at least 75% of the maximum daily high price over the last 250 days. This means that if the maximum price reached in the last 250 days is, for example, ₹100, the closing price should be ₹75 or higher.
2.Market Cap must be greater than or equal to 1000 crores. This means the company’s total market value is at least 1000 crores, indicating a significant size and presence in the market.
3.The daily closing price of the stock must be greater than or equal to the average price calculated over the last 50 days. This means that if the average price over the past 50 days is, for example, ₹100, the current closing price should be at least ₹100 or higher. This indicates that the stock is performing at least as well as its recent average, showing stability or growth.
4.The daily closing price of the stock must be greater than or equal to the average price calculated over the last 200 days. This means that the current price should be at least the same as or higher than the average price from the past 200 days, indicating a stable or upward trend in the stock’s value.
5. All the above mentioned characteristics should be present and I want this for any specific date.
Hello,
We have created the scan. Kindly review.
https://chartink.com/screener/price-of-the-stock-must-be-at-least-75-of-the-maximum-daily-high-price-over-the-last-250-days
hi
I want to create a scanner where i can check if a particular stock has crossed its volume which it hit at a particular time in the past few days,
For eg if its 2:30 now, so has the stock crossed its volume which it does on an average till 2:30 for the last 5 days
For instance volume right now till 2:30 is 100 and it does 110 on an average till 2:30 for the last 5 days,
the time has to be rolling and not fixed, if i check it at 10:30 it should give me stocks till then
Hello,
Unfortunately, we don’t have the feature for the same. Nonetheless, we are actively exploring the option of adding it along with new indicators.
I am unable to provide a specific timeline for the addition of this feature, but I have forwarded your request to our Development team for future consideration.
We value your patience and look forward to enhancing our service for our valuable users.
Hi, I want to one condition as a prerequisite in my existing scanner, that is, Nifty50 should be greater than 20 EMA on daily chart. How can I add this to my scanner?
Hello,
We have created the scan. Kindly review the backtest.
https://chartink.com/screener/nifty50-should-be-greater-than-20-ema-on-daily
Hai sir i need scanner for scalping if the prices cross above & below yesterday high & low with 1.75 % to 2.25% stocks in the range.
Required for index,nsecash,fno and mcx segment
Hello,
Sorry, but your query is not very clear. Could you please elaborate more on the same and, if possible, share a sample chart image for reference to this email ID: [email protected]
1. The Chartink Query Setup
Go to Chartink.com > Create Scan and copy these logic blocks exactly:
Filter 1: The Trend Filter (Gann’s “In Balance” Base)
Pass if [0] Daily Close > [0] Daily SMA( Close, 200 )
And
[0] Daily Close > [0] Daily SMA( Close, 50 )
Filter 2: The “Out of Balance” (Price Expansion) Logic
This identifies stocks where the current 10-day range is wider than the previous 10-day range, signaling a breakout from balance.
And
( [0] Daily Max( 10, High ) – [0] Daily Min( 10, Low ) ) > ( [10] Daily Max( 10, High ) – [10] Daily Min( 10, Low ) )
Filter 3: The Momentum Accelerator (ROC)
Gann’s “Fast Moves” happen when the Rate of Change (ROC) is increasing.
And
[0] Daily ROC( Close, 21 ) > [1] Daily ROC( Close, 21 )
Filter 4: Universe Selection
Change “Segment” from “Cash” to “Futures” (to target the 200+ F&O stocks). please provide the above tmentioned in a scanner
Hello,
We have created the scan. Kindly review.
https://chartink.com/screener/daily-close-0-daily-sma-close-200-and-0-daily-close-0-daily-sma-close-50
Note: We don’t support the ‘future’ segment.
Your scanners are very good. If you add sector and sub-sector names on the scanner page, it will be easier to identify trending sectors while viewing stocks. When multiple stocks from the same sector appear, it helps traders quickly spot intraday and short-term opportunities and trade the strongest sector, making the scanner’s even more effective
ALREADY THERE :-
Sr.
Stock Name
Symbol
Links
% Chg
Price
Volume
ADD THIS :-
SECTOR & SUB SECTOR NAMES
Hello,
Thank you for your appreciation and kind words. Kindly click on the ‘customize column’ button in the result section, and then click on plus sign then select the ‘sector’ and ‘industry’ to add the columns of the same in the result section.
I have a created my screener which are showing in scans however I am unable to view the scrneer on my dashboard
how to add those on my dashboard
Hello,
Here, if you are referring to the scans in the scan dashboard. If yes, here is the link where you will find your saved scans: https://chartink.com/scan_dashboard
If you are referring to the scans in the Atlas. Please note that you have to save those scans in the Atlas. In the scan section, there is a button at the end of ‘run scan’ named ‘more’. Please click on it and then click on ‘monitor on dashboard’. After that select the dashboard of your choice from the pop-up, and your scan is saved in the Atlas dashboard.
Kindly provide the list of all funtions and parameters available in chartink scanners
Hello,
For the functions, you can review our YouTube channel. https://www.youtube.com/@ChartinkConnect
You can click on the ‘plus’ sign to know all the parameters on Chartink in the scan section.
how to view multiple scanner results in one page at time.
how to add sensex index in scanner.
when Forex market & MCX market details will be included